Comments
Velghast t1_ja4wkfn wrote
Companies like Saab, BMW, Nissan, Toyota, and surprisingly Samsung although they are not a car manufacturer, subsidize a lot of their profit margins they get from the civilian sector to fund their military ventures. Rolls-Royce is included in this list as is Volkswagen. Most of South Korea's entire mechanized military is constructed by Samsung.
skyebreak t1_ja4xbn2 wrote
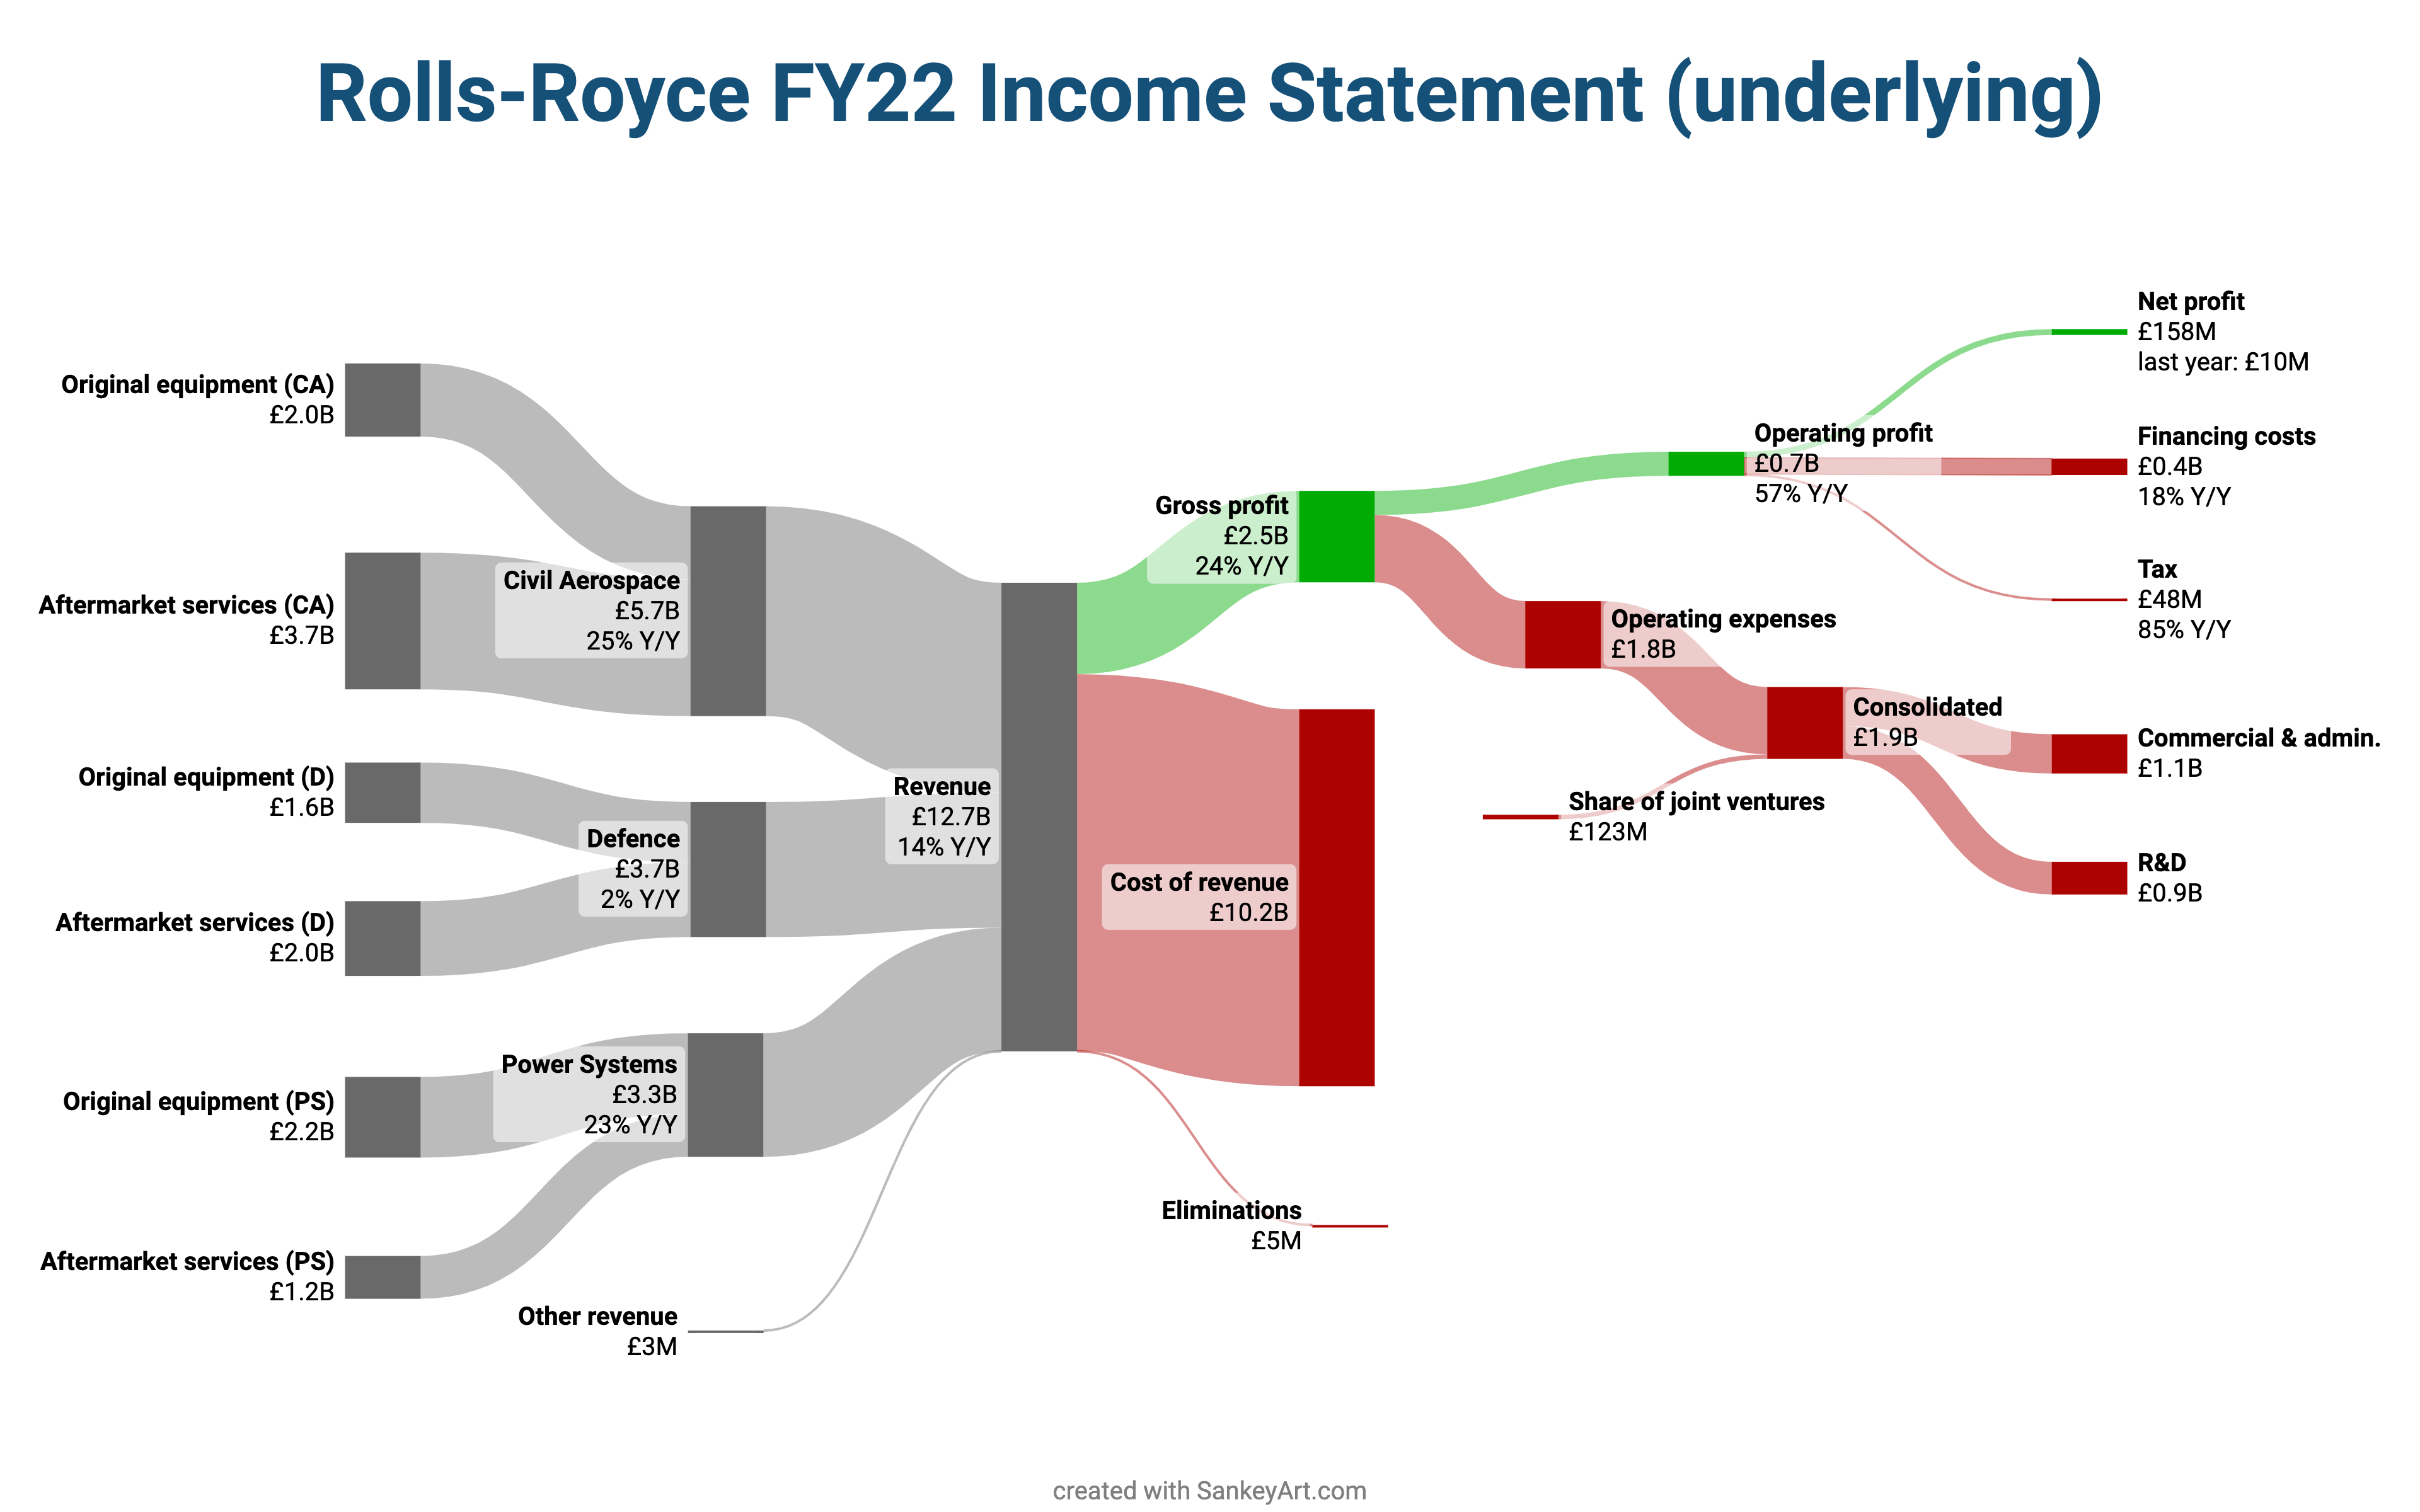
Worth mentioning on the plot that this is Rolls-Royce Holdings, a distinct company from Rolls-Royce Motor Cars...
Big_Knife_SK t1_ja517qg wrote
This is the one that makes plane engines etc, I assume.
st4n13l t1_ja52av2 wrote
This post has nothing to do with the car company. Rolls Royce cars are actually a subsidiary of BMW. This graph is for the defense and aerospace company.
st4n13l t1_ja52crw wrote
Yes it's the defense and aerospace company
IncomeStatementGuy OP t1_ja57vxy wrote
Thanks! Indeed worth mentioning
P_Ston t1_ja5a4af wrote
158M AFTER almost a billion in R&D is still really good
vtTownie t1_ja5bpmi wrote
This is true for all aerospace companies, either massive amounts through R&D or service contracts not really that much $$ in the initial production
Snohoman t1_ja5v5w0 wrote
Remember that they get taxed on any profit so their are a million ways of hiding that profit along the way.
kompootor t1_ja630d9 wrote
How does a graph like this get made for an aerospace company like this -- or I suppose any giant company -- where there are long-term contracts with some significant risk, or current sales that may include a contract for years of included maintenance, as well as sales of hardware alone? I know accounting isn't trivial and there are proper methods of balancing all of this each year, so I suppose I'm asking if someone has a hint as to how this stuff all gets tucked away in a chart like this? (Tbc this is a question reflecting my basic ignorance of accounting -- I'm not saying anything is missing or not properly represented; I am asking if someone might explain how all these types of contracts with complex breakdowns are represented in this visualization)
(Also OP needs to include the source in the image, including date created and date of dataset,)
[deleted] t1_ja6j4qj wrote
[removed]
shibaninja t1_ja6orwc wrote
I guess that means they can spend more than 5 million for their assisination projects.
MelbaToast604 t1_ja6qm9i wrote
And factory fishing boats!
Winjin t1_ja712xv wrote
And a billion in commercial and admin sounds like "we kinda pay for the CEOs meal and housing out of company's pockets"
Winjin t1_ja71525 wrote
A billion in admins sounds like it's one of these things.
vetratten t1_ja79hfy wrote
Item to note, you mix your abbreviations and it becomes clunky.
So .9B on one item but then 158M on the other vs 900M and 158M (or .9B and .158B to keep in line with the rest of the chart).
IDK3177 t1_ja7bied wrote
Check the comments, data source is there
IncomeStatementGuy OP t1_ja7ewvh wrote
Thanks for the feedback.
My rule was to switch to millions for 0.1B and 0.0B as in these cases the billion digit carries little information compared to the size of the number.
Which exact rule would you use instead?
eyekneadhalp t1_ja7h42l wrote
Why are these every post I see on this subreddit now?
vetratten t1_ja7i7tt wrote
Depends on the data and audience and usually we put in a means to switch between thousands, millions, billions on our dashboards.
For a static like this where the numbers have such a wide range I'm torn as I usually prefer everything to be the same notation. The beauty of the Sankey is you could keep the notation by step. So for instance the far right step being in Millions but the middle step in Billions. It's not perfect by any stretch and I'd still be annoyed that they're not all in billions.
wanmoar t1_ja7n06w wrote
You could’ve used either just millions or, if that would make the numbers unclear, use billions but to the second decimal.
pirac t1_ja7qw63 wrote
Whats the incentive for companies like this to exist in todays capitalist world?
Thats a very low return of investment compared to other safe investments.
ferrel_hadley t1_ja7u4qm wrote
You buy the shares, you get a cut of the steady flow of revenue. To maintain the productive capacity the share price retains value and gives returns, so you have an asset you can monetise for its underlying value by selling or maintain a revenue stream from it.
This is how most companies operate. A few like Apple have insane returns, but they have an insane share price. Most of the investor value is locked into share price.
IncomeStatementGuy OP t1_ja82474 wrote
Thanks, I'll play more with these options in my next creation. In general, I like having only a few digits as it makes the numbers quicker to read.
IncomeStatementGuy OP t1_ja829kx wrote
Thanks for the suggestion :-)
wanmoar t1_ja83g8v wrote
Is it really quicker to read if people have to do the extra work of checking for the M or B?

IncomeStatementGuy OP t1_ja4s1kk wrote
Data source: Rolls-Royce Holdings PLC 2022 full-year results
Tools used: SankeyArt (I am developing this tool)