 Comparison of Star Trek Series by IMBD Ratings [OC]
Submitted by insaneplane t3_11zrm7z in dataisbeautiful
insaneplane OP t1_jddrrtd wrote
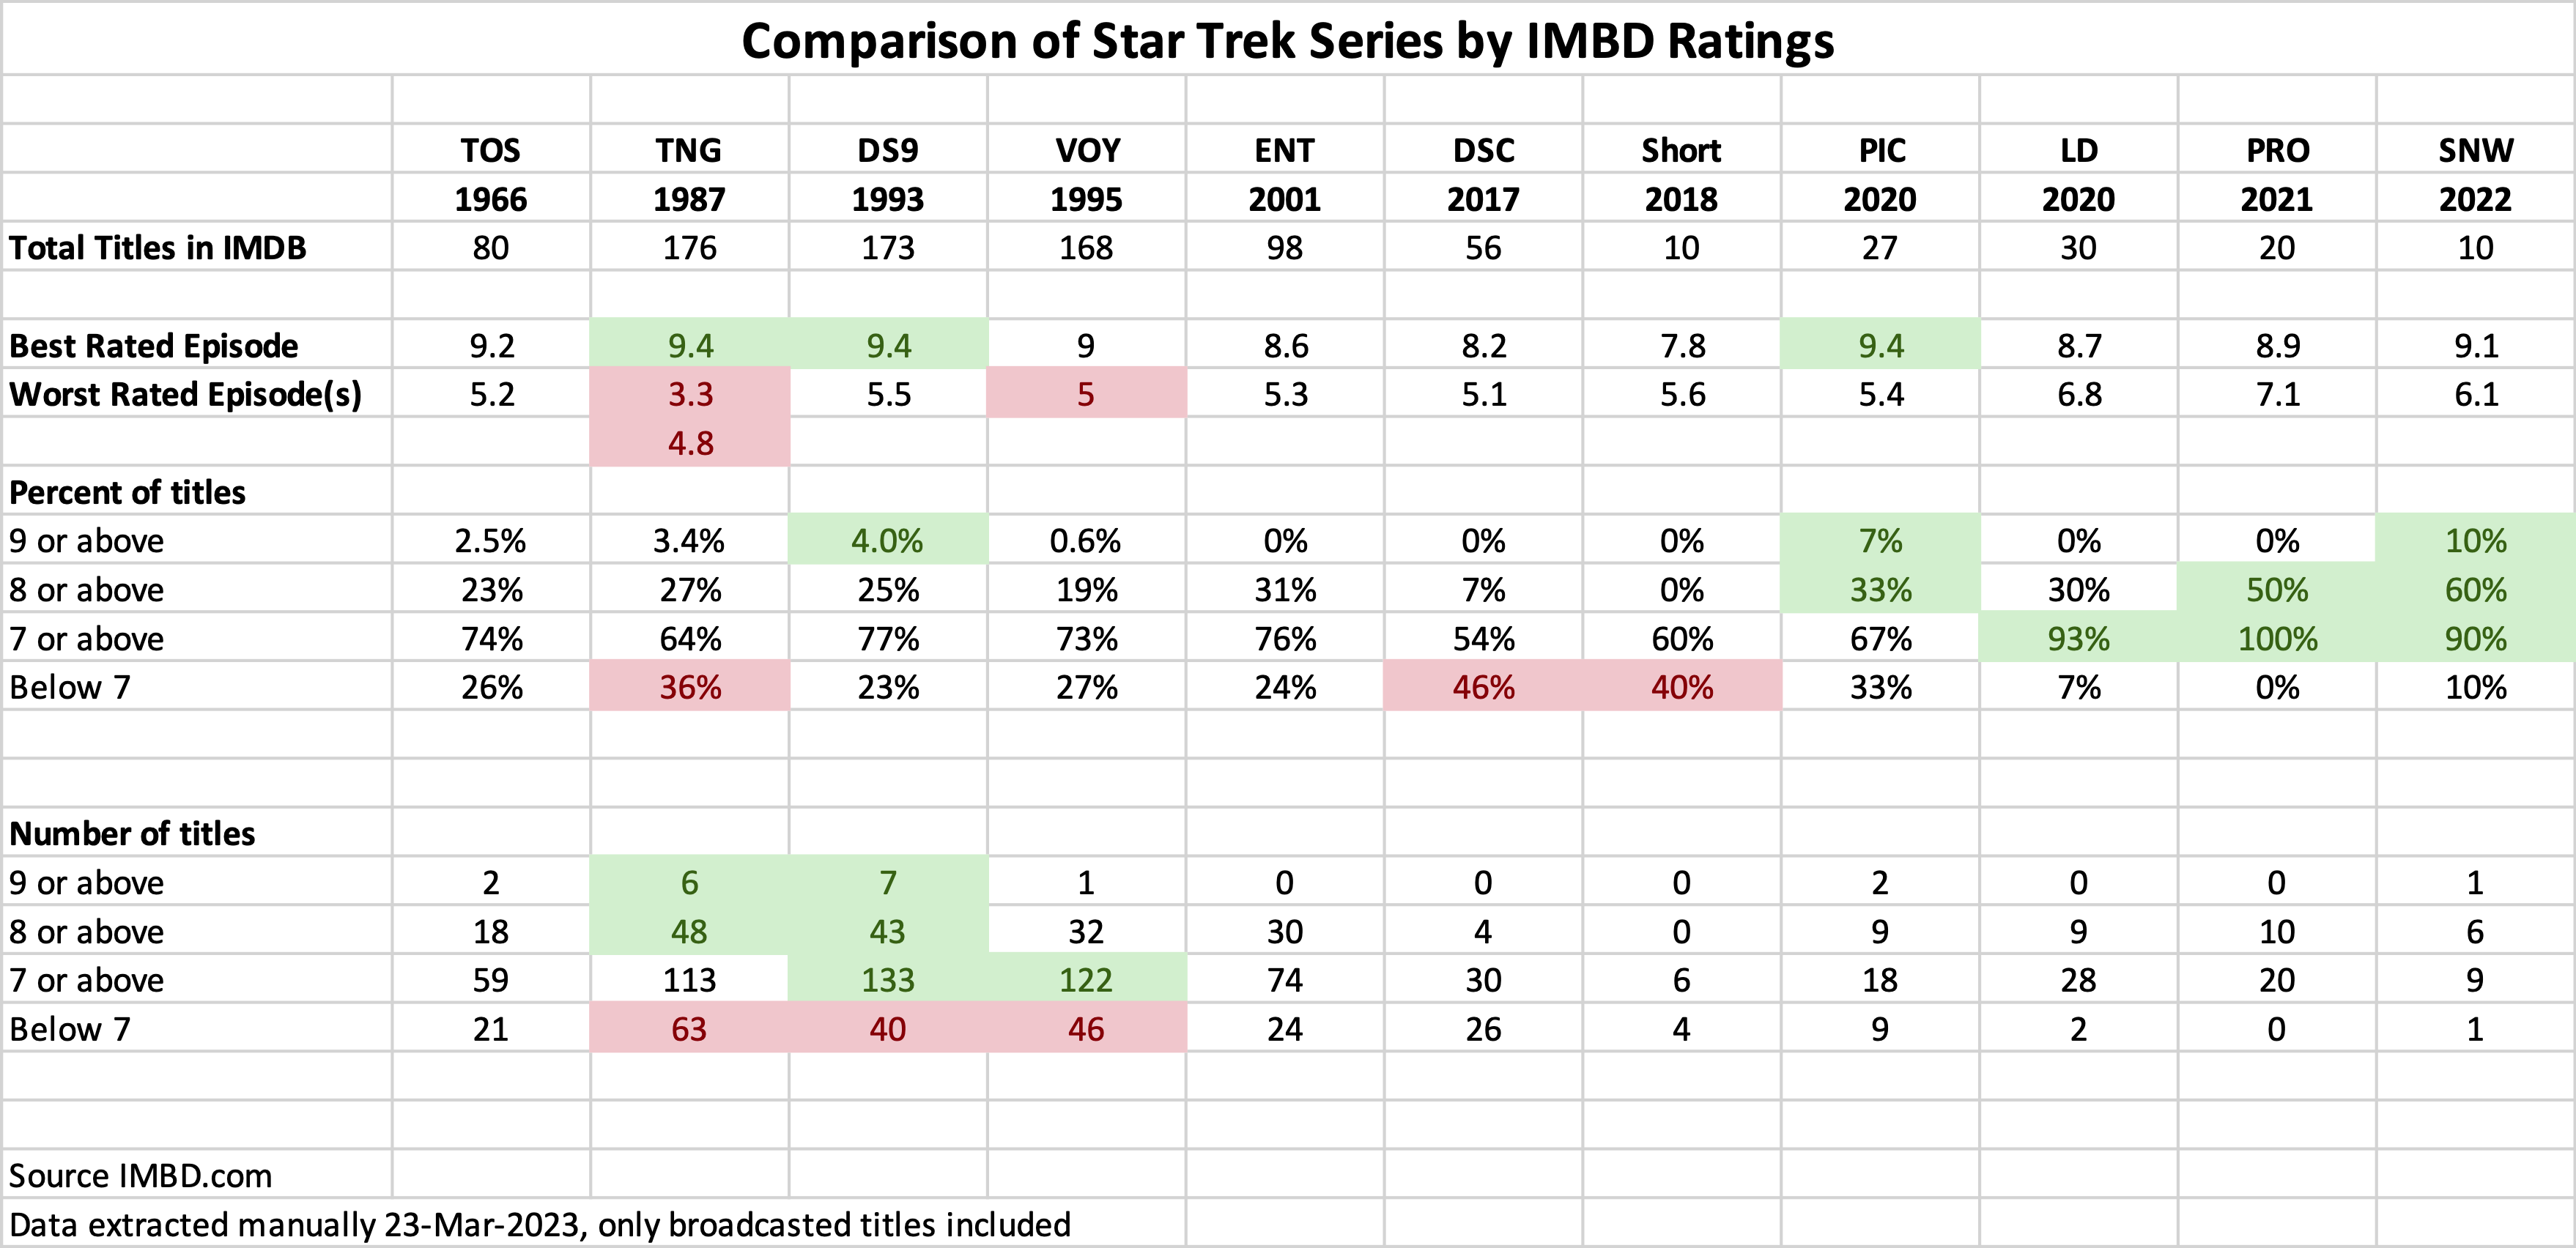
Source IMDB.com. Visualization prepared with Excel.
I hope this data is sufficiently beautiful for this sub! There is both complaining and gushing over so-called "Nu-Trek", so I wanted an easy comparison.
vindictivejazz t1_jddthas wrote
The problem with “Nu-Trek” is that they don’t periodically have some of the weirdest episodes of television I’ve ever seen. There needs to be an episode every season or so that just leaves you baffled as to how it ever made it on screen.
JCPRuckus t1_jdeg6kt wrote
Have you seen the fantasy storybook episode of Strange New Worlds?
vindictivejazz t1_jdehyek wrote
I actually haven’t gotten to SNW yet
JCPRuckus t1_jdej3j3 wrote
Well you'll definitely get your "WTF?"s when you get there.
kukukachu_burr t1_jdek6df wrote
When you do you will see it there.
sheogorath227 t1_jdew8d7 wrote
I enjoyed that one! It was the kind of silly nonsense I love about ST. Definitely less cringe than some of the bad old-Trek episodes.
mikevago t1_jdei6q2 wrote
Not everyone sees that as a bad thing!
GloatingSwine t1_jdfckok wrote
It's the curse of modern TV where everything has to be a slave to the arc. But also modern Trek where the first 85% of the series is them twiddling their thumbs over a season long mystery that they'll then resolve in a rush in the last three episodes.
kukukachu_burr t1_jdek3b1 wrote
I am working on a matrix right now for my job. I consider tables to count as visualizations, personally. They are even listed as such in both Microstrategy and PowerBi. I haven't used Tableau for a whole but you can make grids in there too. I think it is subjective, but this counts for me.
Viewing a single comment thread. View all comments