Submitted by Marlinii t3_y7bxy8 in dataisbeautiful
Comments
swissly60 t1_istq56d wrote
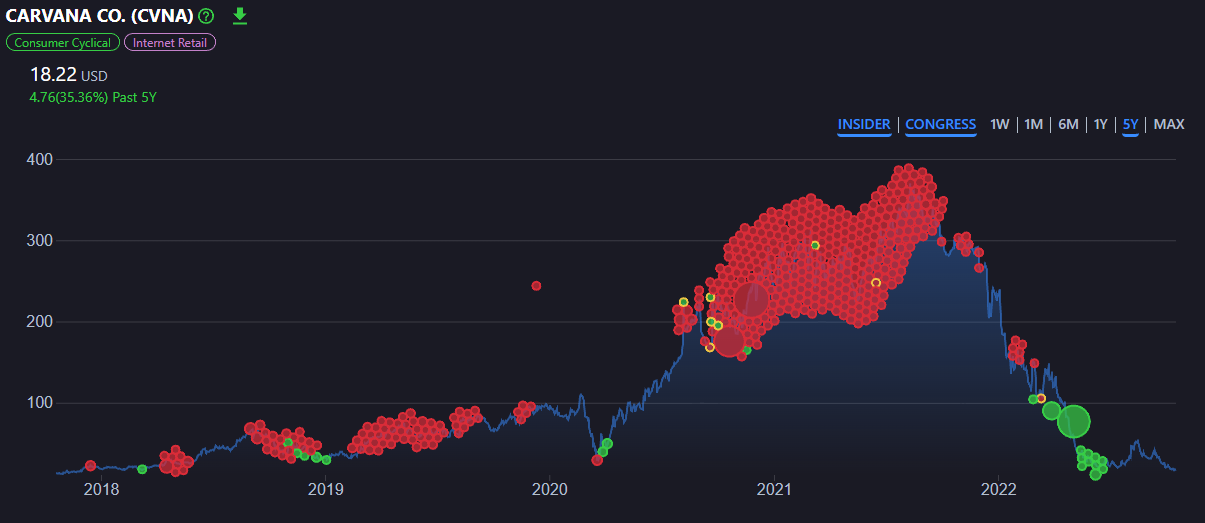
correct, green is buying and red is selling. further, orange outlines are politicians and purple means 'institutional vendor' - not quite sure what that means
685327594 t1_istri7v wrote
Is there a narrative here? Mostly just seems like buying low and selling high.
swissly60 t1_ists0ac wrote
well if you correlate the politicians' moves to bills and such they are endorsing or signing, it explains a little bit... also for insiders it shows some interesting buys/sells i think. these people have secrets and with just enough graphing we can solve them haha
f1FTW t1_iswdtzs wrote
I think the big question is why does (the CEO's father) Earnest Garcia II really need billions of dollars in early 2021. edit: apparently the WSJ covered this: search for "CEO’s Father Gets a $3.6 Billion Stock Windfall at Carvana"
cotteryan t1_isxfr2n wrote
This website is so cool, great to see the visual representations. Thank you!
Marlinii OP t1_isxxs7z wrote
Glad you liked it!
[deleted] t1_it53qkx wrote
[removed]

Marlinii OP t1_istm8lm wrote
Source: https://www.insiderviz.com/company/0001690820
Maps SEC insider trading data to stock price, in this case Carvana. The data viz is interactable if you want to play with it on the site, and all other companies are there as well.
Tool used is d3.js