Submitted by hcrx t3_ys5yum in dataisbeautiful
Comments
Limenoodle_ t1_ivxksli wrote
Is there a reason why it has to load every time? Instead of already having the numbers/emojies stored somewhere?
Barnocious t1_ivxl1l6 wrote
Numbers and countries most likely in a cloud mpp database. The load time is due to the api running a query. This is a really great example of embedded analytics!!
hcrx OP t1_ivxl2wd wrote
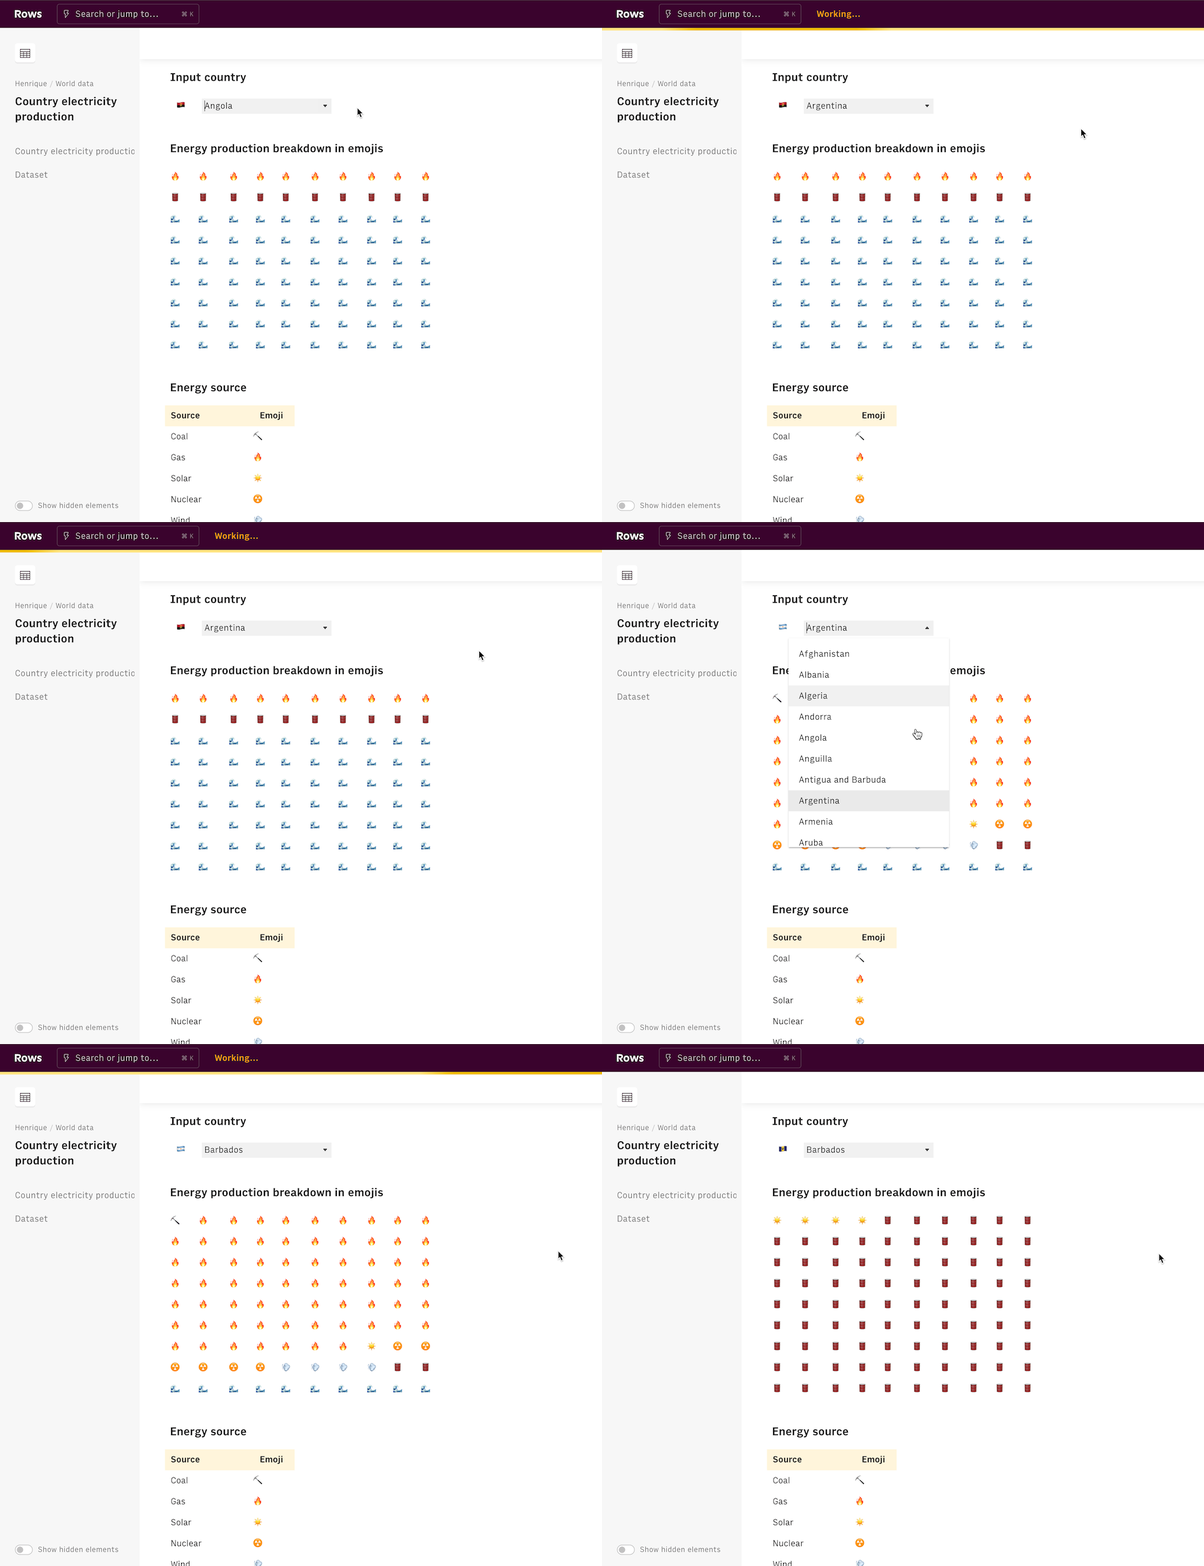
Good question! This is done on a spreadsheet with a table with the energy breakdown by source per country. Then it builds the emoji table when the country changes.
Having one build emoji table per country would be way too heavy, that’s why.
z38ra_ t1_ivxlk0u wrote
Why there are only 90 emojis and not 100?
hcrx OP t1_ivxwqiw wrote
It was a bug, thanks for spotting! Just fixed it
hcrx OP t1_ivy1mp4 wrote
Thank you 🙏
hcrx OP t1_ivy81e3 wrote
You're right, it is electricity. The title is incorrect.
Energy would also count heating (not generated by electricity) and transportation, right.
fearatomato t1_ivyrsd4 wrote
is it a great example because it's really slow?
nothxshadow t1_ivyzrcp wrote
this. People forgot how to make good websites. Nothing is slower than javascript shit that queries a database for every little thing.
Braddigan t1_ivz75ds wrote
Don't think that data looks right. Data shows Hong Kong at 99.71% generated from oil.
Wiki sources showing them at a much more balanced spread in 2020 with Natural gas (44.26%), Coal (28.63%), Imports (26.51%), Other (0.6%). Considering they also list power stations that use gas-fired, coal, and wind power stations the data may be incorrect.
hcrx OP t1_ivzn7mp wrote
I just confirmed and you’re right. I was pulling data from Our world in data be must be doing something wrong in some countries.
According to them, Hong Kong in 2019 is 65% coal and 35% gas.
Thanks for spotting this, I’ll update the underlaying dataset
fearatomato t1_ivzoupk wrote
yeah it's only about 1kb data total for every country combined there's no reason you should have multi second loading times every single time
Super_Hans69 t1_iw09t9r wrote
Really cool thanks for sharing! I'm assuming the breakdown is by energy source proportion of total energy output?
[deleted] t1_iw1hifs wrote
[deleted]
ztbwl t1_iw20pgd wrote
You have 8 numbers (for each energy source) per country - let's say it's a 64 bit number. There is a total of 195 countries on earth.
That's a total weight of about 12.5 KB.
Didn't want to rant, interesting solution though, was fun to discover - but the load times could be better.
hcrx OP t1_iw2ae03 wrote
It’s true, it should be faster. The backend of this is a spreadsheet (so is the FE) so it’s a bunch of Vlookups together to create grid.

hcrx OP t1_ivxgitq wrote
Link with tool to check for any country
https://rows.com/Henrique/world-data/country-electricity-production-4xqtJEDPR7ppP2bKOjzjFh/live
Source data is from Our World in Data
Visualization tool: rows.com