Comments
Mountain-Lecture-320 t1_izsmo4r wrote
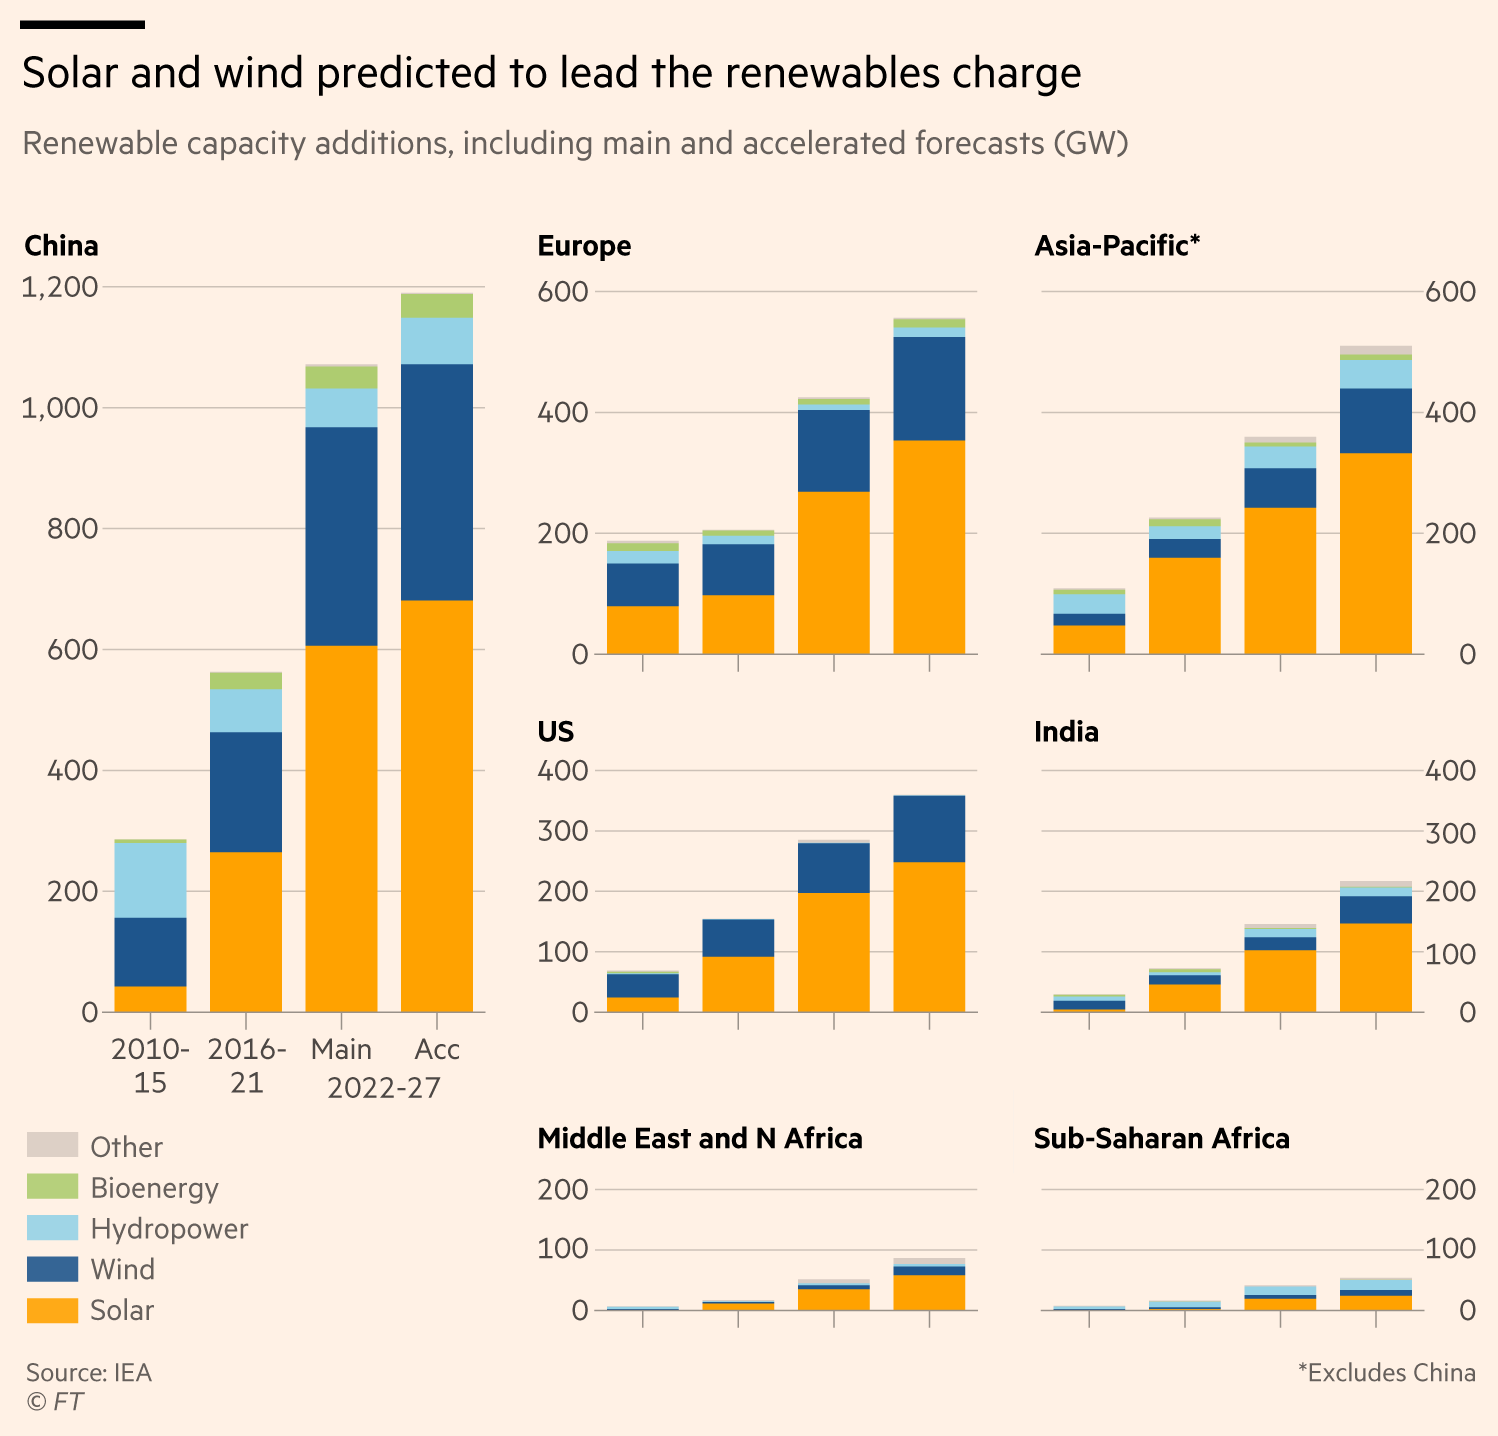
Will you confirm that the y axis scale for all charts is equally spaced? The 200 vs 100 increments make it unclear from a glance.
sdbernard OP t1_izsnvdh wrote
They are indeed equally spaced. Not doing so would make the charts misleading
Mountain-Lecture-320 t1_iztjya5 wrote
With 118 OC, I assumed credibility, but am grateful for your confirmation. Thank you!!!
JerryVand t1_izuip24 wrote
Great job with the X axis consistency, relative to China! My only suggestion would be to remove the lines at 100 and 300 for US and India.
[deleted] t1_izsnava wrote
[deleted]
[deleted] t1_izsngdo wrote
[deleted]
ShoddyView9260 t1_izspdpu wrote
Was there any data on geothermal?
Whatnow2013 t1_izt6jxc wrote
How can you not show the rest of North America? Knowing how much Canada (Quebec notably) produces in Hydro and sells it to the U.S.
Outrageous-Echo-765 t1_izve3km wrote
It's not on the IEA report afaik
Training-Purpose802 t1_izwe5o8 wrote
IEA is notoriously poor in estimating growth in renewable. Not really worth tracking.
tristanjones t1_izstor0 wrote
This needs to be contextualized
What is the expected demand over the same time period for each region?
For all we know the power demand growth rate out paces these capacity increases. Though I doubt it, it is an additional line needed to actually determine the impact of this capacity increase
LookAround-blog t1_iztcmmi wrote
is there any information about how much wind and solar energy will be represented in electricity production in comparison with fossil fuel and nuclear energy sources?
TheMarbleAtTheCenter t1_j06l9s7 wrote
How can we be letting China beat us to energy independence? Pathetic
BergerTimo t1_izu0tcs wrote
Add nuclear and see what’s happening then

sdbernard OP t1_izslnql wrote
Source:IEA
Tools: Excel, d3, Illustrator
China will dominate in renewable energy development over the next five years, increasing capacity by more than the US and Europe combined. It also shows that solar and wind will be the main drivers.
Read our take on the report here