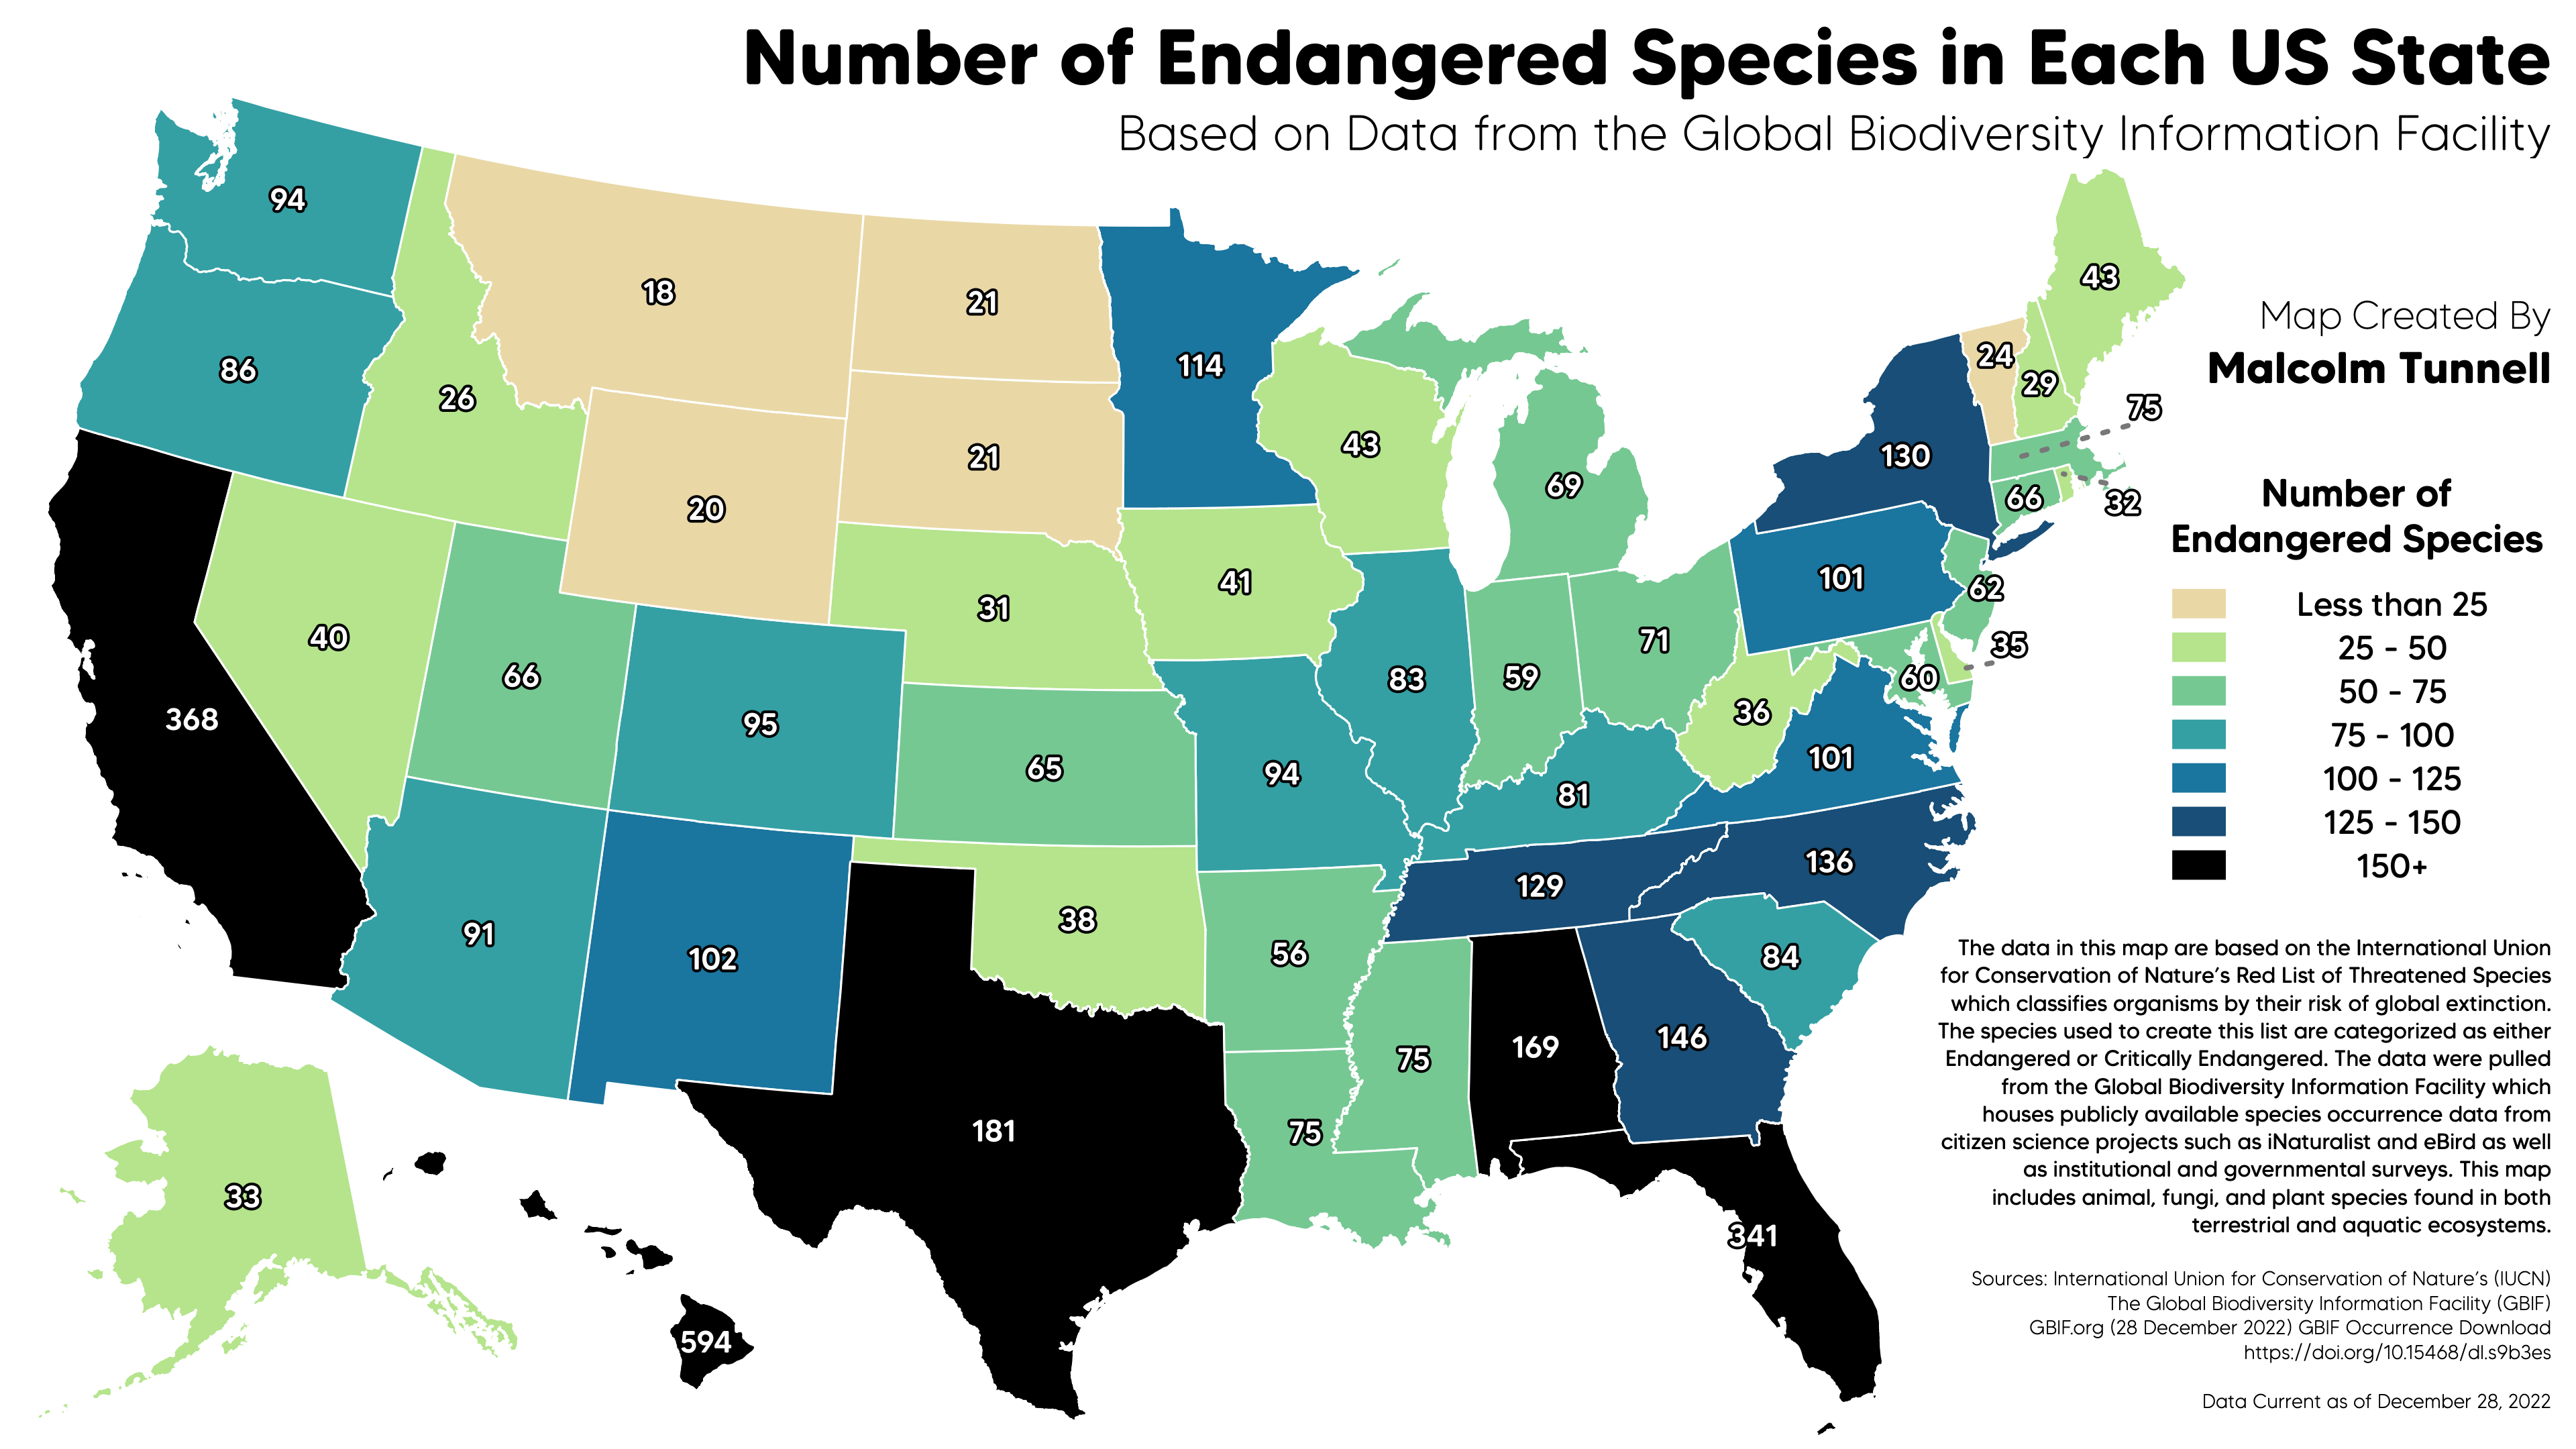
 [OC] The Number of Endangered Species in Each US State
Submitted by malxredleader t3_zxs8k3 in dataisbeautiful
Numerous-Afternoon89 t1_j221ui9 wrote
Great information!
I’d be curious to know:
-
How would/does the density and diversity of the animals in a state affect these numbers. Assuming something like deserts have less biodiversity than wetter areas. Is it possible to classify “total biodiversity in this area / how much of it is endangered”
-
How much does this data depend on what the state classifies as worth saying is endangered. I often hear a “joke” that california protects endangered forests louses, which is why they don’t clean forest floors before fires. I don’t take this for fact, but I would think California is more motivated to classify things as endangered then other states. Who is “reporting” what is endangered, is there bias in the state that may hide endangered species from being counted?
Hope these follow up questions help for whatever you are doing! Thanks again for the information!
malxredleader OP t1_j22ncxn wrote
Hi there! Thank you for the praise! Let me break down your questions:
- It is possible to generate these statistics and to figure out the biodiversity and proportion of endangered species sightings in comparison to the other species present. The two biggest issues are uncertainty of location and the size of the data in question. Because these animals are protected, some of the data is obscured to decrease the likelihood of poaching. This makes certain spatial analysis tricky and can lead to a decrease in accuracy. Second is that there are billions of sightings logged in GBIF and comparing these together even at smaller scales like a country or state become challenging. My lowly MacBook Pro and free GIS software simply doesn't have the bandwidth to conduct that level of analysis (although I really want to!). All of this to say, the solutions you've presented are possible!
- The way a species is defined as endangered for this map is controlled by an international agency. While different states and countries can create their own endangered species list, IUCN is the most internationally recognized. This eliminates bias on the local/state level but doesn't remove our charismatic animal-centric bias which is a big problem facing conservation.
Hopefully those answered your questions!
CyberneticPanda t1_j22oxvw wrote
-
A lot. California has more biodiversity than the northeast US and Canada combined. Texas scores so high because they have a lot of rivers with endangered species. Deserts have a lot of biodiversity actually. Generally speaking, the closer you get to the equator the more biodiversity you have, and the zone where we get deserts is mostly between 30 and 50 degrees north and south.
-
None. California has it's own law and a species that is protected under it is called "a species of special interest to the state of California." The Endangered Species Act is federal law. There is also an international organization called IUCN that designates species as endangered.
mandorlas t1_j22eh7l wrote
Deserts are extremely sensitive environments with a lot of unique wildlife and plant life. If there is a desert in a state I assume nearly everything in it is endangered.
user287449 t1_j22fehh wrote
Would love a second slide that shows the percentage of species threatened.
Visual_Star6820 t1_j22ku35 wrote
Yes this graph begs for more
Viewing a single comment thread. View all comments