Submitted by ale_goldie t3_10n3weu in dataisbeautiful
Comments
[deleted] t1_j66rxr7 wrote
[deleted]
Trombone66 t1_j673bq4 wrote
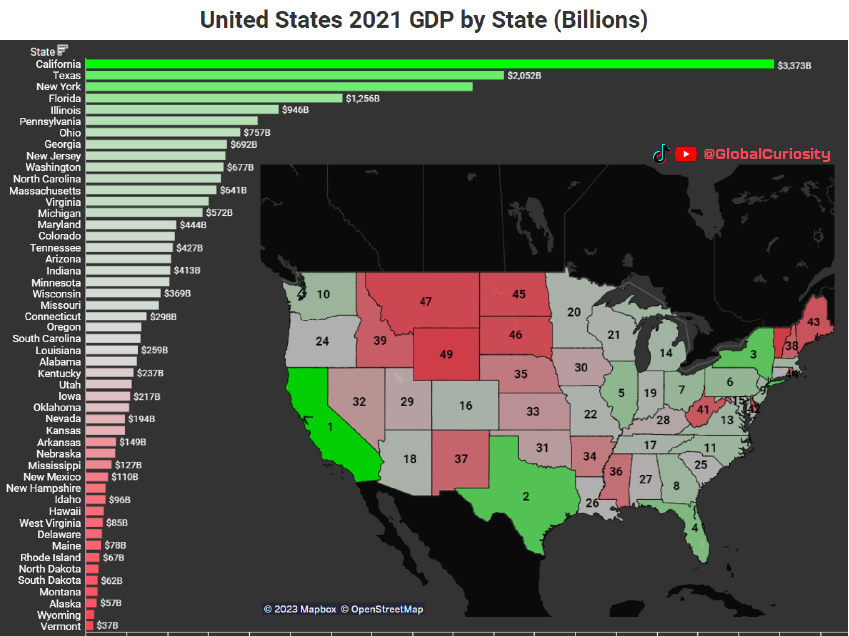
This is interesting, but largely driven by population. I would like to see a map by per capita GDP by state.
ale_goldie OP t1_j6741vt wrote
The positive correction between GDP and population is very strong when I mapped it. There are some outliers such as Massachusetts and Washington though.
Trombone66 t1_j674ki2 wrote
A per capita GDP map would highlight those differences.
0tt0attack t1_j6fbrz7 wrote
This does not show anything beside population numbers.
ale_goldie OP t1_j6g8rke wrote
GDP per Capita visualization is on the way
Consistent_Paper_104 t1_j6jmxfk wrote
I will look forward to seeing that. Enjoyed this as well.

ale_goldie OP t1_j66qy76 wrote
Source: US Bureau of Economic Analysis Tool: Tableau and Adobe Photoshop
Each day in 2023, I am ranking 1 US State economy on my TikTok and YouTube. I have hit the halfway mark and to celebrate, I wanted to make this visualization of GDP.
Apologies that I didn't include the great states of Alaska and Hawaii, they came in at 48th and 40th, respectively.