BurnerAcc2020 t1_j3lj8wo wrote
Reply to comment by maxToTheJ in Deep overturning circulation collapses with strong warming, which could cause a "disaster" in the world's oceans. by sibti
https://www.nature.com/articles/s41467-020-15708-9
>Significant biomass changes are projected in 40%–57% of the global ocean, with 68%–84% of these areas exhibiting declining trends under low and high emission scenarios, respectively.
>
>...Climate change scenarios had a large effect on projected biomass trends. Under a worst-case scenario (RCP8.5, Fig. 2b), 84% of statistically significant trends (p < 0.05) projected a decline in animal biomass over the 21st century, with a global median change of −22%. Rapid biomass declines were projected across most ocean areas (60°S to 60°N) but were particularly pronounced in the North Atlantic Ocean. Under a strong mitigation scenario (RCP2.6, Fig. 2c), 68% of significant trends exhibited declining biomass, with a global median change of −4.8%. Despite the overall prevalence of negative trends, some large biomass increases (>75%) were projected, particularly in the high Arctic Oceans.
>
>Our analysis suggests that statistically significant biomass changes between 2006 and 2100 will occur in 40% (RCP2.6) or 57% (RCPc8.5) of the global ocean, respectively (Fig. 2b, c). For the remaining cells, the signal of biomass change was not separable from the background variability.
https://www.nature.com/articles/s41558-021-01173-9
>Mean projected global marine animal biomass from the full MEM ensemble shows no clear difference between the CMIP5 and CMIP6 simulations until ~2030 (Fig. 3). After 2030, CMIP6-forced models show larger declines in animal biomass, with almost every year showing a more pronounced decrease under strong mitigation and most years from 2060 onwards showing a more pronounced decrease under high emissions (Fig. 3). Both scenarios have a significantly stronger decrease in 2090–2099 under CMIP6 than CMIP5 (two-sided Wilcoxon rank-sum test on annual values; n = 160 for CMIP6, 120 for CMIP5; W = 12,290 and P < 0.01 for strong mitigation, W = 11,221 and P = 0.016 for high emissions).
>
>For the comparable MEM ensemble (Extended Data Fig. 3), only the strong-mitigation scenario is significantly different (n = 120 for both CMIPs; W = 6,623 and P < 0.01). The multiple consecutive decades in which CMIP6 projections are more negative than CMIP5 (Fig. 3b and Extended Data Fig. 3b) suggest that these results are not due simply to decadal variability in the selected ESM ensemble members. Under high emissions, the mean marine animal biomass for the full MEM ensemble declines by ~19% for CMIP6 by 2099 relative to 1990–1999 (~2.5% more than CMIP5), and the mitigation scenario declines by ~7% (~2% more than CMIP5).
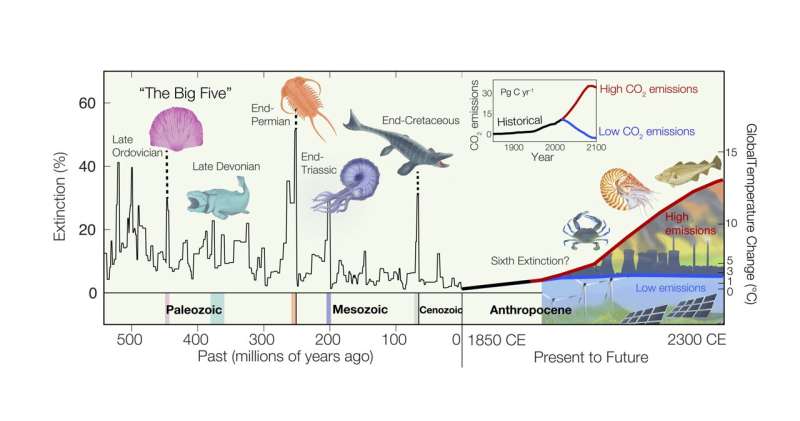
There was even a paper which found that even if the worst-case emission trajectory in those studies somehow continues until 2300 and gets to something like 12 degrees by 2300 (which would necessarily require the world not to collapse until then, btw, as otherwise the emissions wouldn't have anywhere to come from), about half the species in the ocean would still survive.
Viewing a single comment thread. View all comments