Comments
31_SAVAGE_ t1_ja7wyqp wrote
mfer have you heard of a graph
[deleted] t1_jaa5vtl wrote
[removed]
BullBearAlliance t1_ja7nn7j wrote
Terrible
[deleted] t1_ja7o09h wrote
[deleted]
PLTR_Will_Moon t1_ja7mowx wrote
I wonder what song this is?
masstransience t1_ja95q9x wrote
Not a fan of this new visualizar - much prefer Winamp.
technoexplorer t1_ja80qhi wrote
lol. what i thought.
iPigman t1_ja8456o wrote
Despocito.
zeradragon t1_ja8o1xj wrote
Is this WinAmp?
Psychological-Ship85 t1_ja9cjmu wrote
I hear it really kicks a llama's ass
trynafigureitout444 t1_ja80ney wrote
This is actually very interesting because shapes and colours and they’re pretty fun to look at. Good work OP.
technoexplorer t1_ja80owa wrote
Can you make this play music?
scarneo t1_ja7nd12 wrote
Cool...but should have been way slower
turry91 t1_ja81c1z wrote
Advanced crayon
[deleted] t1_ja8k8g4 wrote
[removed]
ThoralfMartell t1_ja86qcr wrote
Awesome visualization!
If you put a "distance volume to daily SPY" chart at the right hand side for each month it could perhaps be a great measure for differentiation over longer time-frames.
TradeTheZones OP t1_ja871sw wrote
Good idea.
I also made this. https://i.imgur.com/T1Jht3J.mp4
It shows the percentage of stocks in each sector that outperformed SPY for the day.
ThoralfMartell t1_ja89vbn wrote
cool a bit like the movie version of finviz groups section (in barchart view)
Bobimus_Maximus t1_ja8bedv wrote
Nice graph looks like we’re all going to be rich
GeneralO1 t1_ja7w231 wrote
I wish I had that many colors of crayons left. When I ran out of red, I started using all the other colors for my losses. I hold the green as hope for the future and motivation to keep buying.
VisualMod t1_ja7lf2z wrote
| User Report | |||
|---|---|---|---|
| Total Submissions | 10 | First Seen In WSB | 7 months ago |
| Total Comments | 218 | Previous Best DD | |
| Account Age | 9 months | [^scan ^comment ](https://www.reddit.com/message/compose/?to=VisualMod&subject=scan_comment&message=Replace%20this%20text%20with%20a%20comment%20ID%20(which%20looks%20like%20h26cq3k)%20to%20have%20the%20bot%20scan%20your%20comment%20and%20correct%20your%20first%20seen%20date.) | [^scan ^submission ](https://www.reddit.com/message/compose/?to=VisualMod&subject=scan_submission&message=Replace%20this%20text%20with%20a%20submission%20ID%20(which%20looks%20like%20h26cq3k)%20to%20have%20the%20bot%20scan%20your%20submission%20and%20correct%20your%20first%20seen%20date.) |
MFJL02 t1_jaa37ct wrote
Yo, MATLAB that shit and get serious about being serious. However, you will need the Statistics, Symbolic, and Machine Learning packs.
downboat t1_ja7s7xc wrote
The kangaroo market is mesmerizing
SteelmanINC t1_ja7zgv6 wrote
Looks like it got much more volatile in february
[deleted] t1_ja82tkp wrote
[removed]
remindsmeofbae t1_ja86f99 wrote
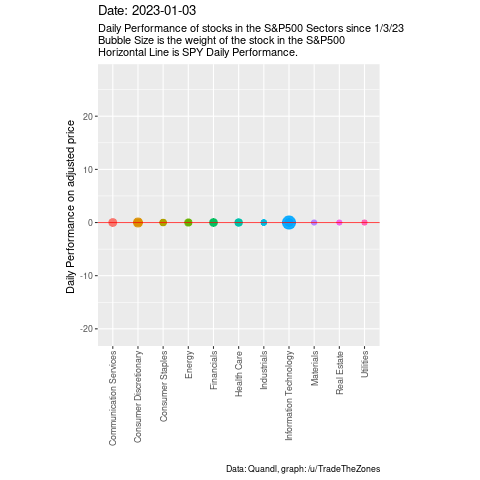
@OP does the SPY reset to zero in this chart daily?
TradeTheZones OP t1_ja8a0nc wrote
Not really. The red line is SPY’s return for the day.
xanthes94 t1_ja88b6g wrote
This is too fast for my smooth brain to understand. Explain it to me with crayons
SuspiciousStable9649 t1_ja8h8cj wrote
So you’re telling me there’s no chance to beat the market?
But seriously a second slower replay after the first pass would be a good move. Or make the first pass even faster to make room for a second slower play. (Assuming the file size is allowed.)
patright333 t1_ja8ialv wrote
Need some Molly to watch that...
Spare-Competition-91 t1_ja8seq1 wrote
OP, do you think I'm a robot? WTF is this?
FoShoMyUsername t1_ja8txsx wrote
Y tho?
The_real_Palygos t1_ja8vtq9 wrote
Good shit. Shows that it’s been a very difficult almost impossible to time anything.
Wonko-D-Sane t1_ja8wn8r wrote
So.... buy SPY, get the same bouncy
SouthernUpstairs t1_ja8xwl6 wrote
Thank you for showing me I’ve lost money in different way and with more colors
Fukitol_shareholder t1_ja91czj wrote
Looks like a equalizer with a Michael Jackson beat…
Jeece712 t1_ja9ixk9 wrote
Looks ugly
pipi_in_your_pampers t1_ja9lrs2 wrote
Why did you scale to +- 20 wtf
TradeTheZones OP t1_ja9lvww wrote
Coz you had some stocks with that much volatility.
Maverick117jj t1_jaat3xe wrote
It goes up and down!
WhiskeySoLo22 t1_jaava6x wrote
Yes, but what does it mean?
AIDA64Doc t1_jab6r9t wrote
Never expected to see ggplot2 on this sub.
Useful_Exchange_208 t1_jab7qn7 wrote
WHAT THE HELL IS THIS 🔥🔥🔥
Odd_Possible_7677 t1_jac0njj wrote
“Forget the needle, buy the haystack.” - John Bogle
Pineapple1500 t1_jac7v14 wrote
This tells me that stocks go up AND down
darsius t1_jaeaokh wrote
facet_wrap(~ Date) +
vaccine9000 t1_ja8cccr wrote
I made a subreddit for the stock Tyson Foods inc TSN Since none existed before. https://www.reddit.com/r/TSNTysonFoods/ If you are interested in discussing this stock feel free to join.
sid_the_sloth69 t1_ja8gvyy wrote
💀
TechWorker_AI_Maybe t1_ja7luq0 wrote
Too fast and too much thinking