 Careful Going Long on Tesla
Submitted by Guysmarket t3_z848g6 in wallstreetbets
Its_me_mikey t1_iy9nym9 wrote
Can someone please explain to me how to read this graph…? Like you would a golden retriever
Advisor_Pretend t1_iy9ohr9 wrote
Red crayons bad green crayons taste better
Thinkingandgrowing t1_iy9oj75 wrote
Stock go up bc people like Elon being invested. Elon sell stock to buy twitter. Elon stock go down so do price of Tesla stock.
EmbarrassedRabbit543 t1_iy9p6or wrote
Perfect.
holyimdepressedmaybe t1_iya0bbi wrote
The music has stopped
joelgreen25 t1_iya1a1v wrote
I didn’t hear no bell
Objective_Squash_567 t1_iyapm51 wrote
Omg this is wholesome y’all seen the movie
CraftsyDad t1_iyarn0j wrote
Do you want to know why I get paid the big dollars?
sheilatucks t1_iydpem6 wrote
Cause you know someone most likely
CraftsyDad t1_iydqr7r wrote
I was quoting the movie (Margin Calls); I wish I got the big bucks but alas no
Bradleynailer t1_iyb2rpa wrote
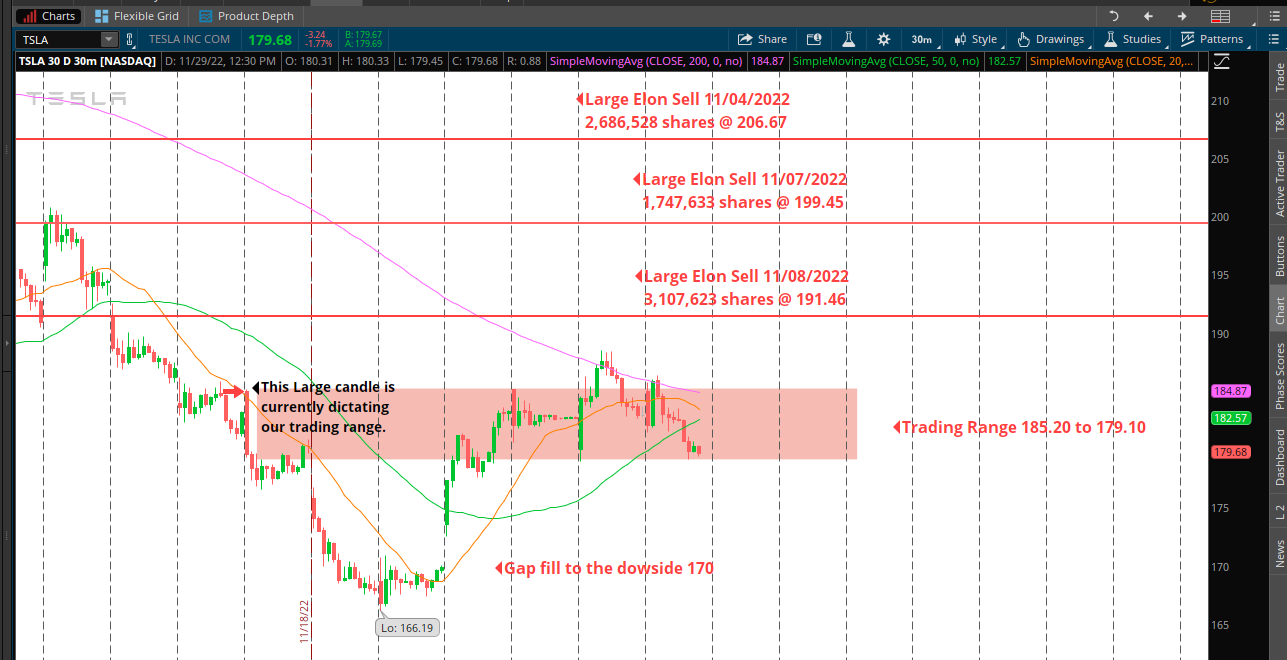
Elon made multiple large sells at a price quote a bit above where the price is now. Currently, the stock is trading in a range below those large sells. Why would Elon sell a bunch of stock if he thought his stocks were cheap? There is also a gap well below the current price. That is where there is a gap in the stock price from one day to the next, usually from some important bit of news. More often than not, those gaps eventually get filled as the stock crosses over those missed prices. If that happens here, Tesla stock price would have to drop quite a bit.
Its_me_mikey t1_iybft4k wrote
This is the kind of answer I was looking for. Thanks king.
Guysmarket OP t1_iybi2xf wrote
what he said
JoseArcadi0 t1_iybvjwt wrote
I was gonna post the same but my leg hurts
ilovethetradio t1_iyb3d7i wrote
It could go up down or sideways! I am sticking to index funds for the time being
Budget-Push7084 t1_iyb5maw wrote
It wasn’t brains that got me here I can assure you of that.
Its_me_mikey t1_iybfx33 wrote
Yup just watched that movie the other day.
Ayoitsjoe t1_iybt56z wrote
So $184 (the top of the red box) is the resistance line. If you see, each day the market is closing in a downtrend, below the resistance line. This means the stock is likely to continue trading sideways, and steadily lower in price. At least that’s what it looks like. I literally know nothing about charts.
SP-Marshmallo t1_iyauija wrote
Green 🚀 Red 💩
MECO-420 t1_iyb37nq wrote
Don’t read the graph,do the exact opposite of what the title says. This is a casino.
canadianzonkeydick t1_iye5fxr wrote
Here Mikey Mikey Mikey!! Come get your treat boy!! Who's a good Mikey boy? Who is? Yes you is!!
Its_me_mikey t1_iye880f wrote
Ooooh ok. Now I get it. Thank you
Viewing a single comment thread. View all comments