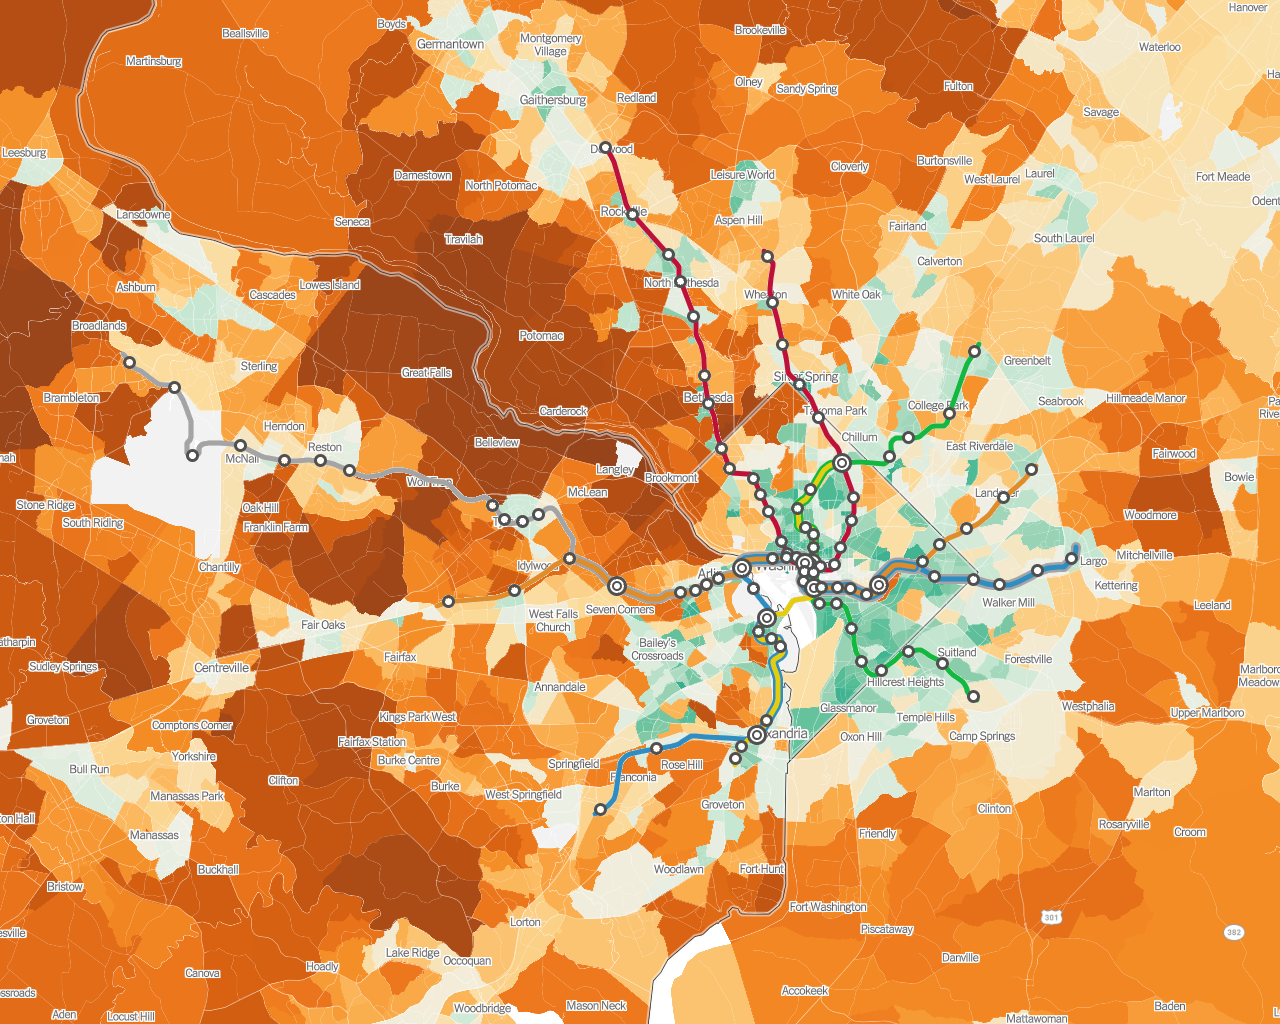
 How transit affects emissions: A map of average household CO2 emissions, with Metrorail routes added
the_bagel_warmonger t1_j0bqvjc wrote
Reply to comment by PrestigiousEbb4608 in How transit affects emissions: A map of average household CO2 emissions, with Metrorail routes added by Golden_Kumquat
Manhattan. Capitol Hill. San Francisco. Literally just look at any rich area that's walkable and we'll served by transit on the map and you will see lower emissions despite their absurd wealth.
Viewing a single comment thread. View all comments