Tambury
Tambury OP t1_itlh22b wrote
Reply to comment by stubob in [OC] Pizza eating challenge by a non-professional eater in a local competition by Tambury
Keep in mind the $100 was thrown in by the boss on the day who had obviously sized up the competitor and taken a punt that he wouldn't make it.
The owner did say that quite a few people actually complete it, but he has made a lot more money out of people attempting the challenge and failing than free pizza given away.
Tambury OP t1_itlflim wrote
Reply to comment by Kwetla in [OC] Pizza eating challenge by a non-professional eater in a local competition by Tambury
Unfortunately it had to be the special of the restaurant.
For those playing at home: Tomato base, cheese, salami, bacon, parmesan and basil pesto
Tambury OP t1_itlf2p1 wrote
Reply to comment by Kip167 in [OC] Pizza eating challenge by a non-professional eater in a local competition by Tambury
Thanks so much for the kind words!
Tambury OP t1_itlf0u7 wrote
Reply to comment by Koldoris in [OC] Pizza eating challenge by a non-professional eater in a local competition by Tambury
Thanks so much!
Tambury OP t1_itleyom wrote
Reply to comment by wex52 in [OC] Pizza eating challenge by a non-professional eater in a local competition by Tambury
Cheers, I appreciate the feedback. It's a difficult concept to convey pizza as a linear unit, especially when most people intuitively think of pizza as an 11-ish inch diameter circle cut into 8 slices. In hindsight, keeping the headline '1 metre of pizza' but using number of slices as the primary axis.
As for energy, I wasn't quite thinking of global appeal when I made it. Kilojoules is standard for energy and is on product labels, though calories is understood. Perhaps I could have added ticks to the other side of the energy axis in Cal at the risk of clutter.
Tambury OP t1_itld665 wrote
Reply to comment by Red__M_M in [OC] Pizza eating challenge by a non-professional eater in a local competition by Tambury
You need to convert from kilojoules to calories
Tambury OP t1_itkljib wrote
Reply to comment by o_monkey in [OC] Pizza eating challenge by a non-professional eater in a local competition by Tambury
Thanks so much for the kind feedback
Tambury OP t1_itkb0u7 wrote
Reply to comment by gab_r95 in [OC] Pizza eating challenge by a non-professional eater in a local competition by Tambury
We were extrapolating as he ate and we were very excited for the first 10 minutes or so but it decayed quickly!
Tambury OP t1_itkaq54 wrote
Reply to comment by Professional_Bike647 in [OC] Pizza eating challenge by a non-professional eater in a local competition by Tambury
Apologies for the confusion, each 'single serve' of pizza is 250mm long cut 3-by-2 = 6 slices. The metre pizza is effectively 4 of these end-on-end (cooked as 2x500mm lengths due to oven limitations).
Hopefully below picture gives context. https://i.redd.it/v5bgqgkzzqv91.jpg
Tambury OP t1_itk59wi wrote
Reply to comment by ASK_IF_IM_PENGUIN in [OC] Pizza eating challenge by a non-professional eater in a local competition by Tambury
He skipped lunch, but that's about all. What he brought to the party was misplaced confidence!
Tambury OP t1_itk3jb6 wrote
Edit: here's a picture of pizza https://i.redd.it/v5bgqgkzzqv91.jpg
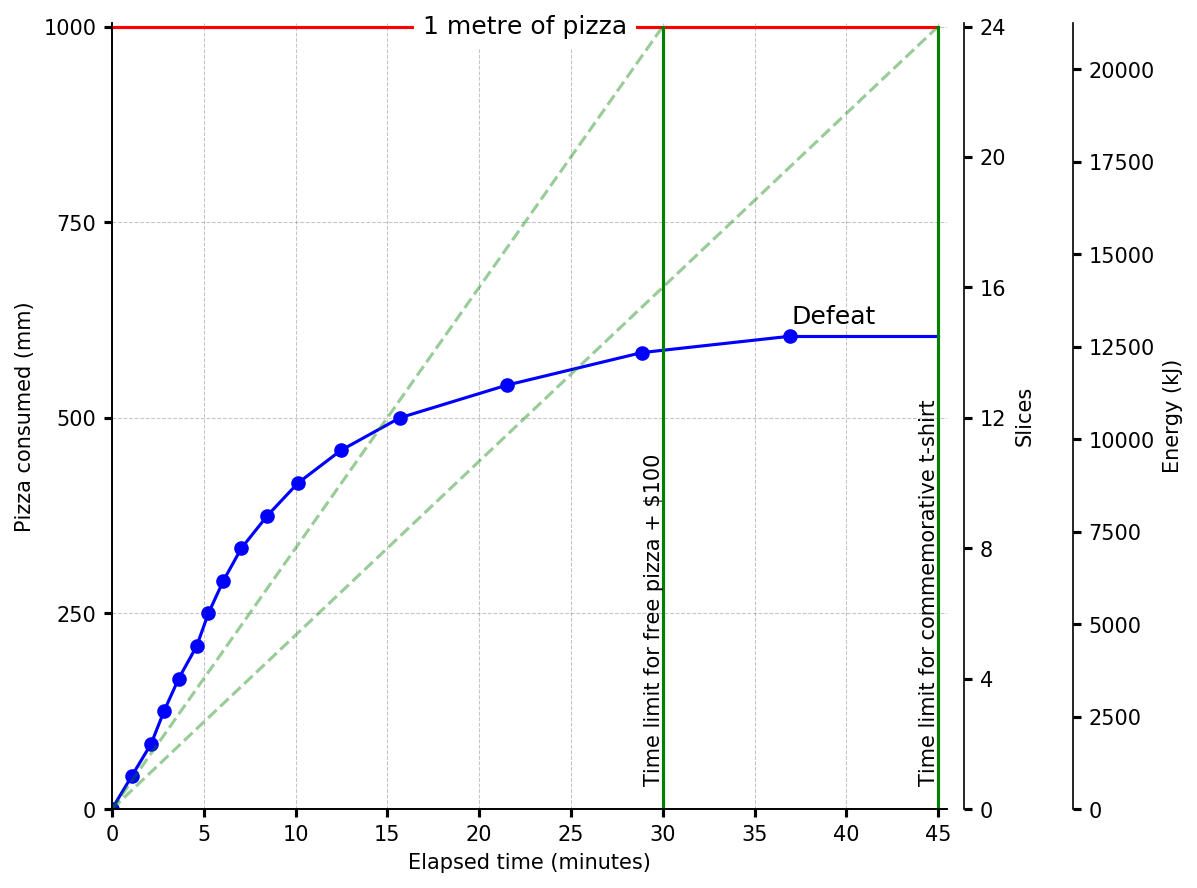
A friend of mine recently attempted a pizza-eating challenge at a local Italian restaurant. The store sells rectangular pizza that is 200mm (8in) wide, and is sold in linear increments of 250mm (10in) or 6 slices.
The store has a challenge of eating a 1 metre (39in) length of pizza - 24 slices.
- If the pizza is consumed in under 45 minutes, the victor wins a t-shirt.
- If the pizza could be eaten in under 30 minutes, the pizza would also be free.
- The owner was feeling particularly generous (or confident) that day, and also offered a $100 cash prize for the 30 minute target.
The data was collected by recording the time measured by a restaurant-supplied stopwatch after each of the 24 pizza slices was fully consumed. Elapsed time was recorded in a spreadsheet app on a smartphone. The graph was plotted using Matplotlib in a Python Notebook. Energy contained within the pizza was approximated by back-calculating the nutritional information of a similarly topped fast-food pizza into a unit rate of energy per area, and then applying that to the area of the pizza.
After 14.5 slices, he admitted defeat and called it.
 [OC] Pizza eating challenge by a non-professional eater in a local competition
Submitted by Tambury t3_yc3j4r in dataisbeautiful
Tambury OP t1_itnx41u wrote
Reply to comment by ProfessorFull in [OC] Pizza eating challenge by a non-professional eater in a local competition by Tambury
Here you go! Apologies for the uncommented spaghetti code.
Data input CSV file below