 [OC] Well-being Distribution based on Income Bracket in the US
Submitted by ketzu t3_11pdcuq in dataisbeautiful
ketzu OP t1_jbx7d0a wrote
Datasource is a scientific article:
- Income and emotional well-being: a conflict resolved" by Killingsworth, Kahneman and Mellers: https://www.pnas.org/doi/10.1073/pnas.2208661120
- Published Data by the authors: https://osf.io/qye4a/
I am not affiliated with the article or authors at all, I just used their published data.
The plot was made using seaborns violin plot and some surrounding stuff (file link).
violin = sb.violinplot(data, x='income', y='wellbeing', scale='count', inner='quartile', width=1.3)
violin.set(xlabel="Income Bracket", ylabel="Wellbeing")
violin.set_xticks(range(15), labels)
violin.set_title("Violin Plot of Wellbeing Distribution, Including Q1, Median, Q3 Highlights")
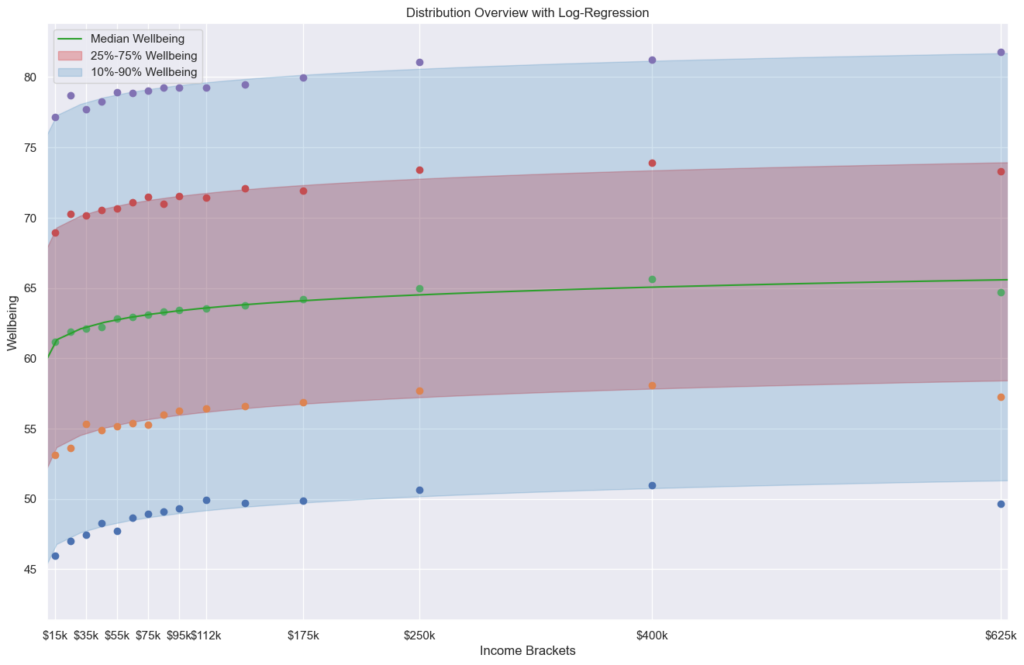
I also made another plot using pyplot to generate statistics accross the income brackets (p10, q1, median, q3 and p90). I like hat one more, but it is even less pretty.
Viewing a single comment thread. View all comments