 [OC] Ratio of Median Home Listing Price (Feb 2023) to Median Family Income (2022 Estimate) For 392 US Metropolitan Statistical Areas
thatdude333 OP t1_jbxjeit wrote
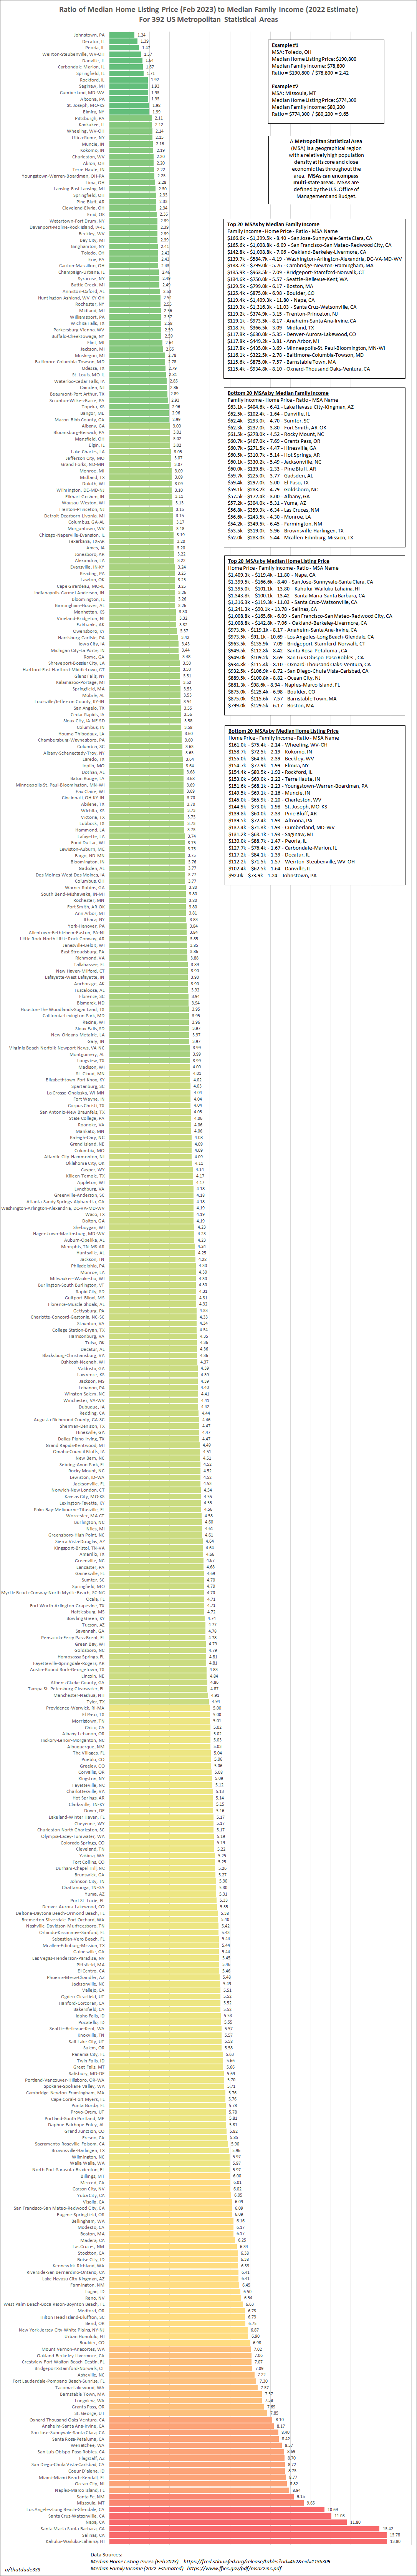
This is a follow up from my previous post 2 days ago, this time showing the ratio between Median Home Listing Price and Median Family Income, as opposed to Per Capita Income. Also listed the top & bottom 20 MSAs for Median Family Income and Median Home Listing Prices.
What are Metropolitan Statistical Areas? - https://en.wikipedia.org/wiki/Metropolitan_statistical_area
Citations:
- Median Home Listing Prices (Feb 2023) - https://fred.stlouisfed.org/release/tables?rid=462&eid=1136309
- Median Family Income (2022 Estimated) - https://www.ffiec.gov/pdf/msa22inc.pdf
Generated in good ol' Excel
CSV Data here -> https://pastebin.com/kP3QFbd8
thatdude333 OP t1_jbxkjy5 wrote
Data with MSA Names alphabetically for easier searching. Split due to post character limit.
MSA Name - Median Family Income ($k) - Median Home Listing Price ($k) - Ratio
- Abilene, TX - $76.9k - $284.9k - 3.7
- Akron, OH - $82k - $180k - 2.2
- Albany, GA - $57.5k - $172.4k - 3
- Albany-Lebanon, OR - $84.9k - $426k - 5.02
- Albany-Schenectady-Troy, NY - $106k - $384.9k - 3.63
- Albuquerque, NM - $77.1k - $388k - 5.03
- Alexandria, LA - $63.8k - $205.2k - 3.22
- Allentown-Bethlehem-Easton, PA-NJ - $94.3k - $362k - 3.84
- Altoona, PA - $72.4k - $139.5k - 1.93
- Amarillo, TX - $77.2k - $359.9k - 4.66
- Ames, IA - $102.4k - $328k - 3.2
- Anaheim-Santa Ana-Irvine, CA - $119.1k - $973.5k - 8.17
- Anchorage, AK - $111.6k - $435.6k - 3.9
- Ann Arbor, MI - $117.8k - $449.2k - 3.81
- Anniston-Oxford, AL - $68.8k - $173.8k - 2.53
- Appleton, WI - $95.9k - $400k - 4.17
- Asheville, NC - $80.3k - $579.5k - 7.22
- Athens-Clarke County, GA - $82.3k - $399.9k - 4.86
- Atlanta-Sandy Springs-Alpharetta, GA - $95.7k - $399.9k - 4.18
- Atlantic City-Hammonton, NJ - $84.2k - $344.5k - 4.09
- Auburn-Opelika, AL - $90k - $380.5k - 4.23
- Augusta-Richmond County, GA-SC - $73.8k - $328.9k - 4.46
- Austin-Round Rock-Georgetown, TX - $110.3k - $532.5k - 4.83
- Bakersfield, CA - $67.9k - $374.9k - 5.52
- Baltimore-Columbia-Towson, MD - $116.1k - $322.5k - 2.78
- Bangor, ME - $82.1k - $243.4k - 2.96
- Barnstable Town, MA - $115.6k - $875k - 7.57
- Baton Rouge, LA - $88.1k - $324.4k - 3.68
- Battle Creek, MI - $73.4k - $182.5k - 2.49
- Bay City, MI - $74.8k - $178.5k - 2.39
- Beaumont-Port Arthur, TX - $80.3k - $232k - 2.89
- Beckley, WV - $64.8k - $155k - 2.39
- Bellingham, WA - $97.3k - $599k - 6.16
- Bend, OR - $97.7k - $659.5k - 6.75
- Billings, MT - $84.8k - $509.2k - 6
- Binghamton, NY - $76.4k - $184.5k - 2.41
- Birmingham-Hoover, AL - $83.3k - $271.7k - 3.26
- Bismarck, ND - $102.6k - $404.5k - 3.94
- Blacksburg-Christiansburg, VA - $79.6k - $347k - 4.36
- Bloomington, IL - $108.5k - $354.2k - 3.26
- Bloomington, IN - $88.5k - $333k - 3.76
- Bloomsburg-Berwick, PA - $79.6k - $239.7k - 3.01
- Boise City, ID - $87k - $554.9k - 6.38
- Boston, MA - $129.5k - $799k - 6.17
- Boulder, CO - $125.4k - $875k - 6.98
- Bowling Green, KY - $70.2k - $332.4k - 4.74
- Bremerton-Silverdale-Port Orchard, WA - $102.5k - $553.8k - 5.4
- Bridgeport-Stamford-Norwalk, CT - $135.9k - $963.5k - 7.09
- Brownsville-Harlingen, TX - $53.5k - $319k - 5.96
- Brunswick, GA - $75k - $395k - 5.27
- Buffalo-Cheektowaga, NY - $87.7k - $227.5k - 2.59
- Burlington, NC - $78.2k - $359.4k - 4.6
- Burlington-South Burlington, VT - $109k - $468.7k - 4.3
- California-Lexington Park, MD - $114.3k - $451.5k - 3.95
- Cambridge-Newton-Framingham, MA - $138.7k - $799k - 5.76
- Camden, NJ - $112.9k - $322.5k - 2.86
- Canton-Massillon, OH - $76.9k - $187k - 2.43
- Cape Coral-Fort Myers, FL - $83.2k - $479.5k - 5.76
- Cape Girardeau, MO-IL - $78.4k - $254.9k - 3.25
- Carbondale-Marion, IL - $76.4k - $127.7k - 1.67
- Carson City, NV - $77.7k - $467.5k - 6.02
- Casper, WY - $85k - $351.5k - 4.14
- Cedar Rapids, IA - $89.2k - $317.2k - 3.56
- Chambersburg-Waynesboro, PA - $85.8k - $308.7k - 3.6
- Champaign-Urbana, IL - $91.3k - $224.5k - 2.46
- Charleston, WV - $65.9k - $145k - 2.2
- Charleston-North Charleston, SC - $96.4k - $498.3k - 5.17
- Charlotte-Concord-Gastonia, NC-SC - $91.7k - $397.4k - 4.33
- Charlottesville, VA - $111.2k - $569.9k - 5.13
- Chattanooga, TN-GA - $75.2k - $398.4k - 5.3
- Cheyenne, WY - $96.5k - $498.6k - 5.17
- Chicago-Naperville-Evanston, IL - $105.7k - $337.5k - 3.19
- Chico, CA - $85k - $427.1k - 5.02
- Cincinnati, OH-KY-IN - $97.4k - $360k - 3.7
- Clarksville, TN-KY - $70.6k - $363.9k - 5.15
- Cleveland, TN - $70.9k - $370k - 5.22
- Cleveland-Elyria, OH - $85.4k - $199.5k - 2.34
- Coeur D'alene, ID - $82.2k - $717.9k - 8.73
- College Station-Bryan, TX - $83k - $360.5k - 4.34
- Colorado Springs, CO - $96.2k - $499k - 5.19
- Columbia, MO - $86.2k - $352.5k - 4.09
- Columbia, SC - $83k - $301.7k - 3.63
- Columbus, GA-AL - $67.5k - $213.8k - 3.17
- Columbus, IN - $95k - $339.9k - 3.58
- Columbus, OH - $95.6k - $360k - 3.77
- Corpus Christi, TX - $80.9k - $326.6k - 4.04
- Corvallis, OR - $111.2k - $564.5k - 5.08
- Crestview-Fort Walton Beach-Destin, FL - $89.7k - $634k - 7.07
- Cumberland, MD-WV - $71.3k - $137.4k - 1.93
- Dallas-Plano-Irving, TX - $97.4k - $435k - 4.47
- Dalton, GA - $66.8k - $279.9k - 4.19
- Danville, IL - $62.5k - $102.4k - 1.64
- Daphne-Fairhope-Foley, AL - $85.5k - $496.5k - 5.81
- Davenport-Moline-Rock Island, IA-IL - $87.2k - $208.7k - 2.39
- Decatur, AL - $70.6k - $307.5k - 4.36
- Decatur, IL - $84.1k - $117.2k - 1.39
- Deltona-Daytona Beach-Ormond Beach, FL - $73.5k - $395.6k - 5.38
- Denver-Aurora-Lakewood, CO - $117.8k - $630k - 5.35
- Des Moines-West Des Moines, IA - $98.1k - $369.9k - 3.77
- Detroit-Dearborn-Livonia, MI - $72.8k - $229.5k - 3.15
- Dothan, AL - $70.1k - $257.7k - 3.68
- Dover, DE - $77.2k - $398.2k - 5.16
- Dubuque, IA - $87.5k - $386.9k - 4.42
- Duluth, WI - $88.2k - $272.1k - 3.09
- Durham-Chapel Hill, NC - $92.9k - $489k - 5.26
- East Stroudsburg, PA - $85.6k - $330k - 3.86
- Eau Claire, WI - $90k - $332.5k - 3.69
- El Centro, CA - $63.9k - $349k - 5.46
- El Paso, TX - $59.4k - $297k - 5
- Elgin, IL - $111.9k - $337.5k - 3.02
- Elizabethtown-Fort Knox, KY - $78.8k - $316.5k - 4.02
- Elkhart-Goshen, IN - $83.6k - $260.2k - 3.11
- Elmira, NY - $77.9k - $154.7k - 1.99
- Enid, OK - $84.5k - $199.8k - 2.36
- Erie, PA - $75k - $182.5k - 2.43
- Eugene-Springfield, OR - $84k - $511.2k - 6.09
- Evansville, IN-KY - $83.7k - $270.9k - 3.24
- Fairbanks, AK - $97.8k - $324.7k - 3.32
- Fargo, ND-MN - $100.5k - $377.2k - 3.75
- Farmington, NM - $54.2k - $349.5k - 6.45
- Fayetteville, NC - $66.4k - $340k - 5.12
- Fayetteville-Springdale-Rogers, AR - $83.7k - $403k - 4.81
- Flagstaff, AZ - $85.2k - $741.3k - 8.7
- Flint, MI - $71.6k - $189.3k - 2.64
- Florence, SC - $64.8k - $255k - 3.94
- Florence-Muscle Shoals, AL - $68.2k - $294.3k - 4.32
- Fond Du Lac, WI - $97.2k - $364.2k - 3.75
- Fort Collins, CO - $72.3k - $379.7k - 5.25
- Fort Lauderdale-Pompano Beach-Sunrise, FL - $82.1k - $599k - 7.3
- Fort Smith, AR-OK - $62.3k - $237k - 3.8
- Fort Wayne, IN - $79.1k - $319.6k - 4.04
- Fort Worth-Arlington-Grapevine, TX - $92.4k - $435k - 4.71
- Fresno, CA - $72.9k - $426.5k - 5.85
- Gadsden, AL - $59.7k - $225k - 3.77
- Gainesville, FL - $79.7k - $373.6k - 4.69
- Gainesville, GA - $87.7k - $477.5k - 5.44
- Gary, IN - $85.1k - $337.5k - 3.97
- Gettysburg, PA - $90.3k - $391k - 4.33
- Glens Falls, NY - $86.3k - $302.5k - 3.51
- Goldsboro, NC - $59.1k - $283.2k - 4.79
- Grand Forks, ND-MN - $92.8k - $284.5k - 3.07
- Grand Island, NE - $72.2k - $295.1k - 4.09
- Grand Junction, CO - $83.5k - $485.8k - 5.82
- Grand Rapids-Kentwood, MI - $88.9k - $398.9k - 4.49
- Grants Pass, OR - $60.7k - $467k - 7.69
- Great Falls, MT - $72.7k - $411.8k - 5.66
- Greeley, CO - $102.5k - $518.7k - 5.06
- Green Bay, WI - $90.7k - $434.4k - 4.79
- Greensboro-High Point, NC - $70.3k - $324.3k - 4.61
- Greenville, NC - $72.2k - $337k - 4.67
- Greenville-Anderson, SC - $80.3k - $335.9k - 4.18
- Gulfport-Biloxi, MS - $69.5k - $299.2k - 4.31
- Hagerstown-Martinsburg, MD-WV - $77.5k - $327.5k - 4.23
- Hammond, LA - $69.7k - $259.7k - 3.73
- Hanford-Corcoran, CA - $68k - $375.3k - 5.52
- Harrisburg-Carlisle, PA - $94.3k - $322.4k - 3.42
- Harrisonburg, VA - $80.5k - $349.9k - 4.35
- Hartford-East Hartford-Middletown, CT - $113.2k - $396.4k - 3.5
- Hattiesburg, MS - $63.2k - $298.6k - 4.72
- Hickory-Lenoir-Morganton, NC - $69.6k - $349.9k - 5.03
- Hilton Head Island-Bluffton, SC - $94.6k - $636.5k - 6.73
- Hinesville, GA - $60.7k - $271.5k - 4.47
- Homosassa Springs, FL - $68.6k - $330k - 4.81
- Hot Springs, AR - $60.5k - $310.7k - 5.14
- Houma-Thibodaux, LA - $69.4k - $249.5k - 3.6
- Houston-The Woodlands-Sugar Land, TX - $90.8k - $358.3k - 3.95
- Huntington-Ashland, WV-KY-OH - $68k - $172.7k - 2.54
- Huntsville, AL - $92.7k - $394.2k - 4.25
- Idaho Falls, ID - $82.7k - $457.5k - 5.53
- Indianapolis-Carmel-Anderson, IN - $91.9k - $299.5k - 3.26
- Iowa City, IA - $104.3k - $357.5k - 3.43
- Ithaca, NY - $100.3k - $384k - 3.83
- Jackson, MI - $84.3k - $223.8k - 2.65
- Jackson, MS - $74k - $324.9k - 4.39
- Jackson, TN - $64.3k - $274.9k - 4.28
- Jacksonville, FL - $86.1k - $390k - 4.53
- Jacksonville, NC - $60.1k - $330.2k - 5.49
- Janesville-Beloit, WI - $81.2k - $312.7k - 3.85
- Jefferson City, MO - $83.5k - $256.2k - 3.07
- Johnson City, TN - $75.3k - $399.4k - 5.3
- Johnstown, PA - $73.9k - $92k - 1.24
- Jonesboro, AR - $70.6k - $227.5k - 3.22
- Joplin, MO - $65k - $236.7k - 3.64
- Kahului-Wailuku-Lahaina, HI - $101.1k - $1395k - 13.8
- Kalamazoo-Portage, MI - $86.6k - $304.5k - 3.52
- Kankakee, IL - $85.2k - $180.9k - 2.12
- Kansas City, MO-KS - $97.3k - $442.5k - 4.55
- Kennewick-Richland, WA - $87.5k - $559.5k - 6.39
- Killeen-Temple, TX - $74.5k - $310.9k - 4.17
- Kingsport-Bristol, TN-VA - $69.7k - $323.1k - 4.64
- Kingston, NY - $96k - $489k - 5.09
- Knoxville, TN - $82k - $457.1k - 5.57
- Kokomo, IN - $72.5k - $158.7k - 2.19
- La Crosse-Onalaska, WI-MN - $90.8k - $366.9k - 4.04
- Lafayette, LA - $74.9k - $279.9k - 3.74
- Lafayette-West Lafayette, IN - $78.1k - $304.9k - 3.9
- Lake Charles, LA - $75k - $228.8k - 3.05
- Lake Havasu City-Kingman, AZ - $63.1k - $404.6k - 6.41
- Lakeland-Winter Haven, FL - $67.5k - $349k - 5.17
thatdude333 OP t1_jbxkmcn wrote
- Lancaster, PA - $90.2k - $422.5k - 4.68
- Lansing-East Lansing, MI - $86.8k - $199.9k - 2.3
- Laredo, TX - $66k - $240k - 3.64
- Las Cruces, NM - $56.8k - $359.9k - 6.34
- Las Vegas-Henderson-Paradise, NV - $81.7k - $445.5k - 5.45
- Lawrence, KS - $99.1k - $434.9k - 4.39
- Lawton, OK - $66.7k - $216.5k - 3.25
- Lebanon, PA - $85.6k - $376.9k - 4.4
- Lewiston, ID-WA - $92.8k - $419.5k - 4.52
- Lewiston-Auburn, ME - $83.6k - $313.7k - 3.75
- Lexington-Fayette, KY - $87.3k - $397.5k - 4.55
- Lima, OH - $77.3k - $176.3k - 2.28
- Lincoln, NE - $91.2k - $441.3k - 4.84
- Little Rock-North Little Rock-Conway, AR - $79k - $304.2k - 3.85
- Logan, ID - $76.9k - $499.9k - 6.5
- Longview, TX - $73.9k - $295k - 3.99
- Longview, WA - $75.1k - $569.6k - 7.58
- Los Angeles-Long Beach-Glendale, CA - $91.1k - $973.5k - 10.69
- Louisville/Jefferson County, KY-IN - $84.7k - $300k - 3.54
- Lubbock, TX - $80.5k - $300k - 3.73
- Lynchburg, VA - $78.9k - $329.9k - 4.18
- Macon-Bibb County, GA - $70.1k - $209.9k - 2.99
- Madera, CA - $75.5k - $471.8k - 6.25
- Madison, WI - $111.8k - $446.9k - 4
- Manchester-Nashua, NH - $114.5k - $562.2k - 4.91
- Manhattan, KS - $80k - $264k - 3.3
- Mankato, MN - $94.9k - $384.9k - 4.06
- Mansfield, OH - $70.7k - $213.2k - 3.02
- Mcallen-Edinburg-Mission, TX - $52k - $283k - 5.44
- Medford, OR - $81.4k - $548k - 6.73
- Memphis, TN-MS-AR - $76.2k - $323.1k - 4.24
- Merced, CA - $73.1k - $439.5k - 6.01
- Miami-Miami Beach-Kendall, FL - $68.3k - $599k - 8.77
- Michigan City-La Porte, IN - $79k - $272k - 3.44
- Midland, MI - $94.2k - $241.5k - 2.56
- Midland, TX - $118.7k - $366.5k - 3.09
- Milwaukee-Waukesha, WI - $96.1k - $412.8k - 4.3
- Minneapolis-St. Paul-Bloomington, MN-WI - $117.8k - $435k - 3.69
- Missoula, MT - $80.2k - $774.3k - 9.65
- Mobile, AL - $68k - $239.8k - 3.53
- Modesto, CA - $79.3k - $489.5k - 6.17
- Monroe, LA - $56.6k - $243.5k - 4.3
- Monroe, MI - $85.8k - $265k - 3.09
- Montgomery, AL - $75.5k - $301.2k - 3.99
- Morgantown, WV - $94.2k - $299.2k - 3.18
- Morristown, TN - $70.7k - $354.2k - 5.01
- Mount Vernon-Anacortes, WA - $86.1k - $604.3k - 7.02
- Muncie, IN - $69.1k - $149.5k - 2.16
- Muskegon, MI - $70.6k - $196k - 2.78
- Myrtle Beach-Conway-North Myrtle Beach, SC-NC - $77.5k - $364.2k - 4.7
- Napa, CA - $119.4k - $1409.3k - 11.8
- Naples-Marco Island, FL - $98.6k - $881.3k - 8.94
- Nashville-Davidson-Murfreesboro, TN - $95.6k - $517.8k - 5.42
- New Bern, NC - $75.1k - $338.5k - 4.51
- New Haven-Milford, CT - $99.2k - $387k - 3.9
- New Orleans-Metairie, LA - $81.8k - $324.6k - 3.97
- New York-Jersey City-White Plains, NY-NJ - $99k - $680k - 6.87
- Niles, MI - $73.7k - $339.4k - 4.61
- North Port-Sarasota-Bradenton, FL - $90.4k - $539.5k - 5.97
- Norwich-New London, CT - $106k - $481.7k - 4.54
- Oakland-Berkeley-Livermore, CA - $142.8k - $1008.8k - 7.06
- Ocala, FL - $65.2k - $307k - 4.71
- Ocean City, NJ - $100.8k - $889.5k - 8.82
- Odessa, TX - $92.7k - $259k - 2.79
- Ogden-Clearfield, UT - $99.6k - $550k - 5.52
- Oklahoma City, OK - $84.9k - $349.2k - 4.11
- Olympia-Lacey-Tumwater, WA - $103.5k - $537.5k - 5.19
- Omaha-Council Bluffs, IA - $95.1k - $428.6k - 4.51
- Orlando-Kissimmee-Sanford, FL - $80.1k - $435k - 5.43
- Oshkosh-Neenah, WI - $85k - $371.4k - 4.37
- Owensboro, KY - $75.6k - $254.7k - 3.37
- Oxnard-Thousand Oaks-Ventura, CA - $115.4k - $934.8k - 8.1
- Palm Bay-Melbourne-Titusville, FL - $82.3k - $374.9k - 4.56
- Panama City, FL - $78.1k - $440k - 5.63
- Parkersburg-Vienna, WV - $69.5k - $180k - 2.59
- Pensacola-Ferry Pass-Brent, FL - $79.5k - $379.9k - 4.78
- Peoria, IL - $88.7k - $130k - 1.47
- Philadelphia, PA - $75k - $322.5k - 4.3
- Phoenix-Mesa-Chandler, AZ - $88.8k - $487k - 5.48
- Pine Bluff, AR - $60k - $139.8k - 2.33
- Pittsburgh, PA - $94.8k - $200k - 2.11
- Pittsfield, MA - $87.3k - $476.7k - 5.46
- Pocatello, ID - $73.3k - $407k - 5.55
- Port St. Lucie, FL - $84.5k - $450k - 5.33
- Portland-South Portland, ME - $101.6k - $590k - 5.81
- Portland-Vancouver-Hillsboro, OR-WA - $106.5k - $607.1k - 5.7
- Providence-Warwick, RI-MA - $99.6k - $498.1k - 5
- Provo-Orem, UT - $96k - $555k - 5.78
- Pueblo, CO - $68.6k - $347.4k - 5.06
- Punta Gorda, FL - $76k - $439k - 5.78
- Racine, WI - $89.5k - $354.5k - 3.96
- Raleigh-Cary, NC - $110.1k - $449.5k - 4.08
- Rapid City, SD - $90.2k - $388.5k - 4.31
- Reading, PA - $90.7k - $294.6k - 3.25
- Redding, CA - $89.8k - $399.1k - 4.44
- Reno, NV - $96.5k - $631.5k - 6.54
- Richmond, VA - $101.1k - $392.5k - 3.88
- Riverside-San Bernardino-Ontario, CA - $87.4k - $559.9k - 6.41
- Roanoke, VA - $86.2k - $350k - 4.06
- Rochester, MN - $109k - $413.8k - 3.8
- Rochester, NY - $91.2k - $232.5k - 2.55
- Rockford, IL - $80.5k - $154.4k - 1.92
- Rocky Mount, NC - $61.5k - $278k - 4.52
- Rome, GA - $70.7k - $245.8k - 3.48
- Sacramento-Roseville-Folsom, CA - $102.4k - $604.5k - 5.9
- Saginaw, MI - $68.1k - $131.2k - 1.93
- Salem, OR - $89.1k - $497.3k - 5.58
- Salinas, CA - $90.1k - $1241.3k - 13.78
- Salisbury, MD-DE - $89k - $506k - 5.69
- Salt Lake City, UT - $102.2k - $570k - 5.58
- San Angelo, TX - $87.3k - $309.9k - 3.55
- San Antonio-New Braunfels, TX - $84k - $340k - 4.05
- San Diego-Chula Vista-Carlsbad, CA - $106.9k - $932.5k - 8.72
- San Francisco-San Mateo-Redwood City, CA - $165.6k - $1008.8k - 6.09
- San Jose-Sunnyvale-Santa Clara, CA - $166.6k - $1399.5k - 8.4
- San Luis Obispo-Paso Robles, CA - $109.2k - $949k - 8.69
- Santa Cruz-Watsonville, CA - $119.3k - $1316.3k - 11.03
- Santa Fe, NM - $80.6k - $737.5k - 9.15
- Santa Maria-Santa Barbara, CA - $100.1k - $1343.8k - 13.42
- Santa Rosa-Petaluma, CA - $112.8k - $949.5k - 8.42
- Savannah, GA - $83.4k - $399k - 4.78
- Scranton-Wilkes-Barre, PA - $74.1k - $217k - 2.93
- Seattle-Bellevue-Kent, WA - $134.6k - $750k - 5.57
- Sebastian-Vero Beach, FL - $79.9k - $434.5k - 5.44
- Sebring-Avon Park, FL - $63.5k - $286.9k - 4.52
- Sheboygan, WI - $84.6k - $357.5k - 4.23
- Sherman-Denison, TX - $78.2k - $349.8k - 4.47
- Shreveport-Bossier City, LA - $65.5k - $229k - 3.5
- Sierra Vista-Douglas, AZ - $64.5k - $299.4k - 4.64
- Sioux City, IA-NE-SD - $86.1k - $308.5k - 3.58
- Sioux Falls, SD - $90.7k - $359.9k - 3.97
- South Bend-Mishawaka, IN-MI - $77.5k - $294.4k - 3.8
- Spartanburg, SC - $74.7k - $301k - 4.03
- Spokane-Spokane Valley, WA - $83.8k - $478.8k - 5.71
- Springfield, IL - $95.4k - $163.1k - 1.71
- Springfield, MA - $91.3k - $322.5k - 3.53
- Springfield, MO - $69.2k - $325k - 4.7
- Springfield, OH - $69.3k - $161.4k - 2.33
- St. Cloud, MN - $88.5k - $354.9k - 4.01
- St. George, UT - $83.9k - $658.6k - 7.85
- St. Joseph, MO-KS - $73k - $144.9k - 1.98
- St. Louis, MO-IL - $96.8k - $271.6k - 2.81
- State College, PA - $97.3k - $394.9k - 4.06
- Staunton, VA - $83.6k - $363.2k - 4.34
- Stockton, CA - $85k - $542.6k - 6.38
- Sumter, SC - $62.4k - $293k - 4.7
- Syracuse, NY - $91.1k - $226.6k - 2.49
- Tacoma-Lakewood, WA - $101.8k - $750k - 7.37
- Tallahassee, FL - $81.4k - $316.4k - 3.89
- Tampa-St. Petersburg-Clearwater, FL - $82.1k - $400k - 4.87
- Terre Haute, IN - $69k - $153k - 2.22
- Texarkana, TX-AR - $69.9k - $223.5k - 3.2
- The Villages, FL - $83.3k - $420k - 5.04
- Toledo, OH - $78.8k - $190.8k - 2.42
- Topeka, KS - $82.7k - $244.5k - 2.96
- Trenton-Princeton, NJ - $119.2k - $374.9k - 3.15
- Tucson, AZ - $81.1k - $387k - 4.77
- Tulsa, OK - $81.3k - $354.3k - 4.36
- Tuscaloosa, AL - $73k - $286.5k - 3.92
- Twin Falls, ID - $74.5k - $421.5k - 5.66
- Tyler, TX - $82.2k - $405.9k - 4.94
- Urban Honolulu, HI - $113.3k - $781.3k - 6.9
- Utica-Rome, NY - $82.4k - $177k - 2.15
- Valdosta, GA - $63.7k - $279.9k - 4.39
- Vallejo, CA - $108.7k - $599k - 5.51
- Victoria, TX - $74.7k - $278.4k - 3.73
- Vineland-Bridgeton, NJ - $72.3k - $240k - 3.32
- Virginia Beach-Norfolk-Newport News, VA-NC - $93.2k - $371.5k - 3.99
- Visalia, CA - $66.9k - $407.5k - 6.09
- Waco, TX - $73.8k - $309.5k - 4.19
- Walla Walla, WA - $83.6k - $499k - 5.97
- Warner Robins, GA - $80.9k - $307.5k - 3.8
- Washington-Arlington-Alexandria, DC-VA-MD-WV - $139.7k - $584.7k - 4.19
- Waterloo-Cedar Falls, IA - $90.1k - $257.2k - 2.85
- Watertown-Fort Drum, NY - $72.7k - $173.7k - 2.39
- Wausau-Weston, WI - $86.9k - $271.9k - 3.13
- Weirton-Steubenville, WV-OH - $71.5k - $112.2k - 1.57
- Wenatchee, WA - $78.8k - $675k - 8.57
- West Palm Beach-Boca Raton-Boynton Beach, FL - $90.3k - $599k - 6.63
- Wheeling, WV-OH - $75.4k - $161k - 2.14
- Wichita Falls, TX - $78.5k - $202.5k - 2.58
- Wichita, KS - $85.7k - $320k - 3.73
- Williamsport, PA - $77.9k - $199.9k - 2.57
- Wilmington, DE-MD-NJ - $103.9k - $322.5k - 3.1
- Wilmington, NC - $89k - $531k - 5.97
- Winchester, VA-WV - $96.4k - $425k - 4.41
- Winston-Salem, NC - $74.8k - $330k - 4.41
- Worcester, MA-CT - $107.9k - $494k - 4.58
- Yakima, WA - $111.3k - $583.9k - 5.25
- York-Hanover, PA - $93.3k - $358.7k - 3.84
- Youngstown-Warren-Boardman, OH-PA - $68.1k - $151.6k - 2.23
- Yuba City, CA - $75.9k - $459.5k - 6.05
- Yuma, AZ - $57.2k - $304k - 5.31
RBoylson1028 t1_jc18u7e wrote
This is awesome!
It would be really interesting to see the median costs standardized based on property size - as I'm noticing a few instances where a location's median cost is inflated by the fact that the typical home is much larger than in other areas.
For instance, going off median home cost alone, you might assume that the relative cost of living in New York City ($680k) is about 2.26x that of Lubbock, TX ($300k). But when you factor in property size, a home in NYC sells for $640/ft²... which is 4.71x that of Lubbock at only $136/ft². And that's not even factoring in acreage lol. But that data might be hard to find at this level.
unclegabriel t1_jc4y2s6 wrote
It would be interesting to see this visualized on a map
Viewing a single comment thread. View all comments