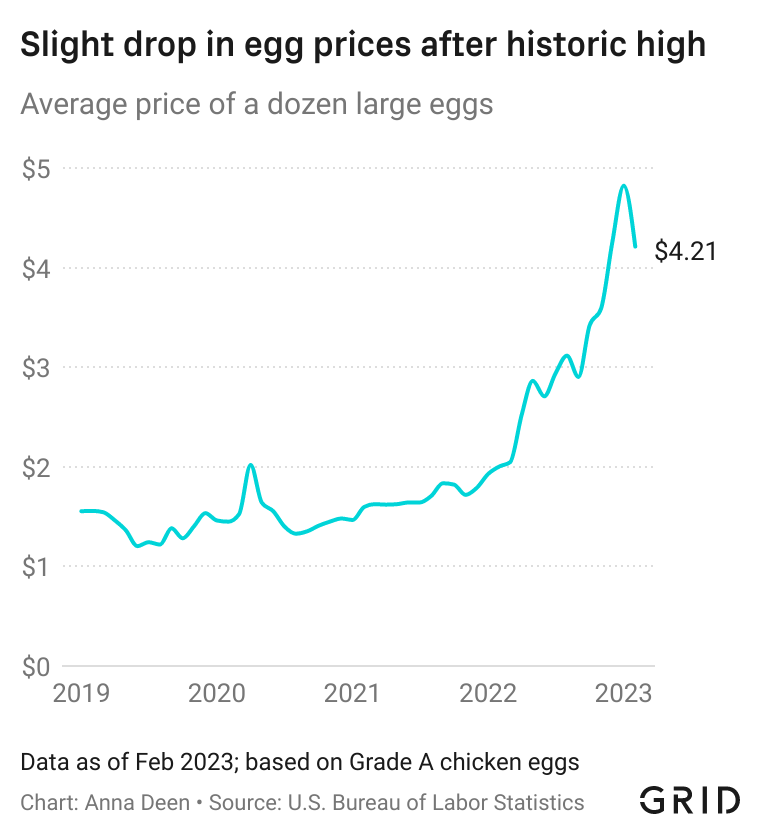
 [OC] The price of a dozen large eggs in the U.S., 2019-2023
Submitted by gridnews t3_11su03l in dataisbeautiful
gridnews OP t1_jcfeotk wrote
kompootor t1_jcfz8tu wrote
When you list a source, whether in your graph or in the post here (I'd say especially in the post, but it should be in the graph too), a user must be able to verify the data. I cannot find the source data, and I followed the link to the CPI site.
Furthermore, the source is definitely not the site on which you originally post the graph -- for one thing, that is not "OC". If it's from a newsletter, that's your secondary citation, whereas you still have to make the primary citation to the original data so that, again, we can verify the numbers, who calculated them, their methodology (definitions, date range, their own data sources, etc.), among other things.
gridnews OP t1_jcg0l97 wrote
Hey, that's a great note. We just updated the above post to include a link to the data source. Apologies! Let us know if that works.
kompootor t1_jcg8g15 wrote
Yes, it links to the data. I recommend you amend the newsletter to include the source as well, if you want people to take your publication seriously. (I know it's just a simple 2D line graph of the data, but that's perfectly ok for a professional visualization -- what's not ok is not linking to the data directly if available.)
Your title, or something, needs to clarify that it's either using CPI or adjusted for inflation -- either works. BLS also publishes data on "average price" in USD, which is not adjusted, so what you have is ambiguous at best -- though my initial assumption was that your graph wasn't adjusted, because a lot of times data that's not adjusted does not explicitly specify that it's "not adjusted" -- see e.g. any graph or dataset from IMF. So that really needs to be specified.
Viewing a single comment thread. View all comments