Submitted by USAFacts_Official t3_zau5ip in dataisbeautiful
Submitted by USAFacts_Official t3_zau5ip in dataisbeautiful
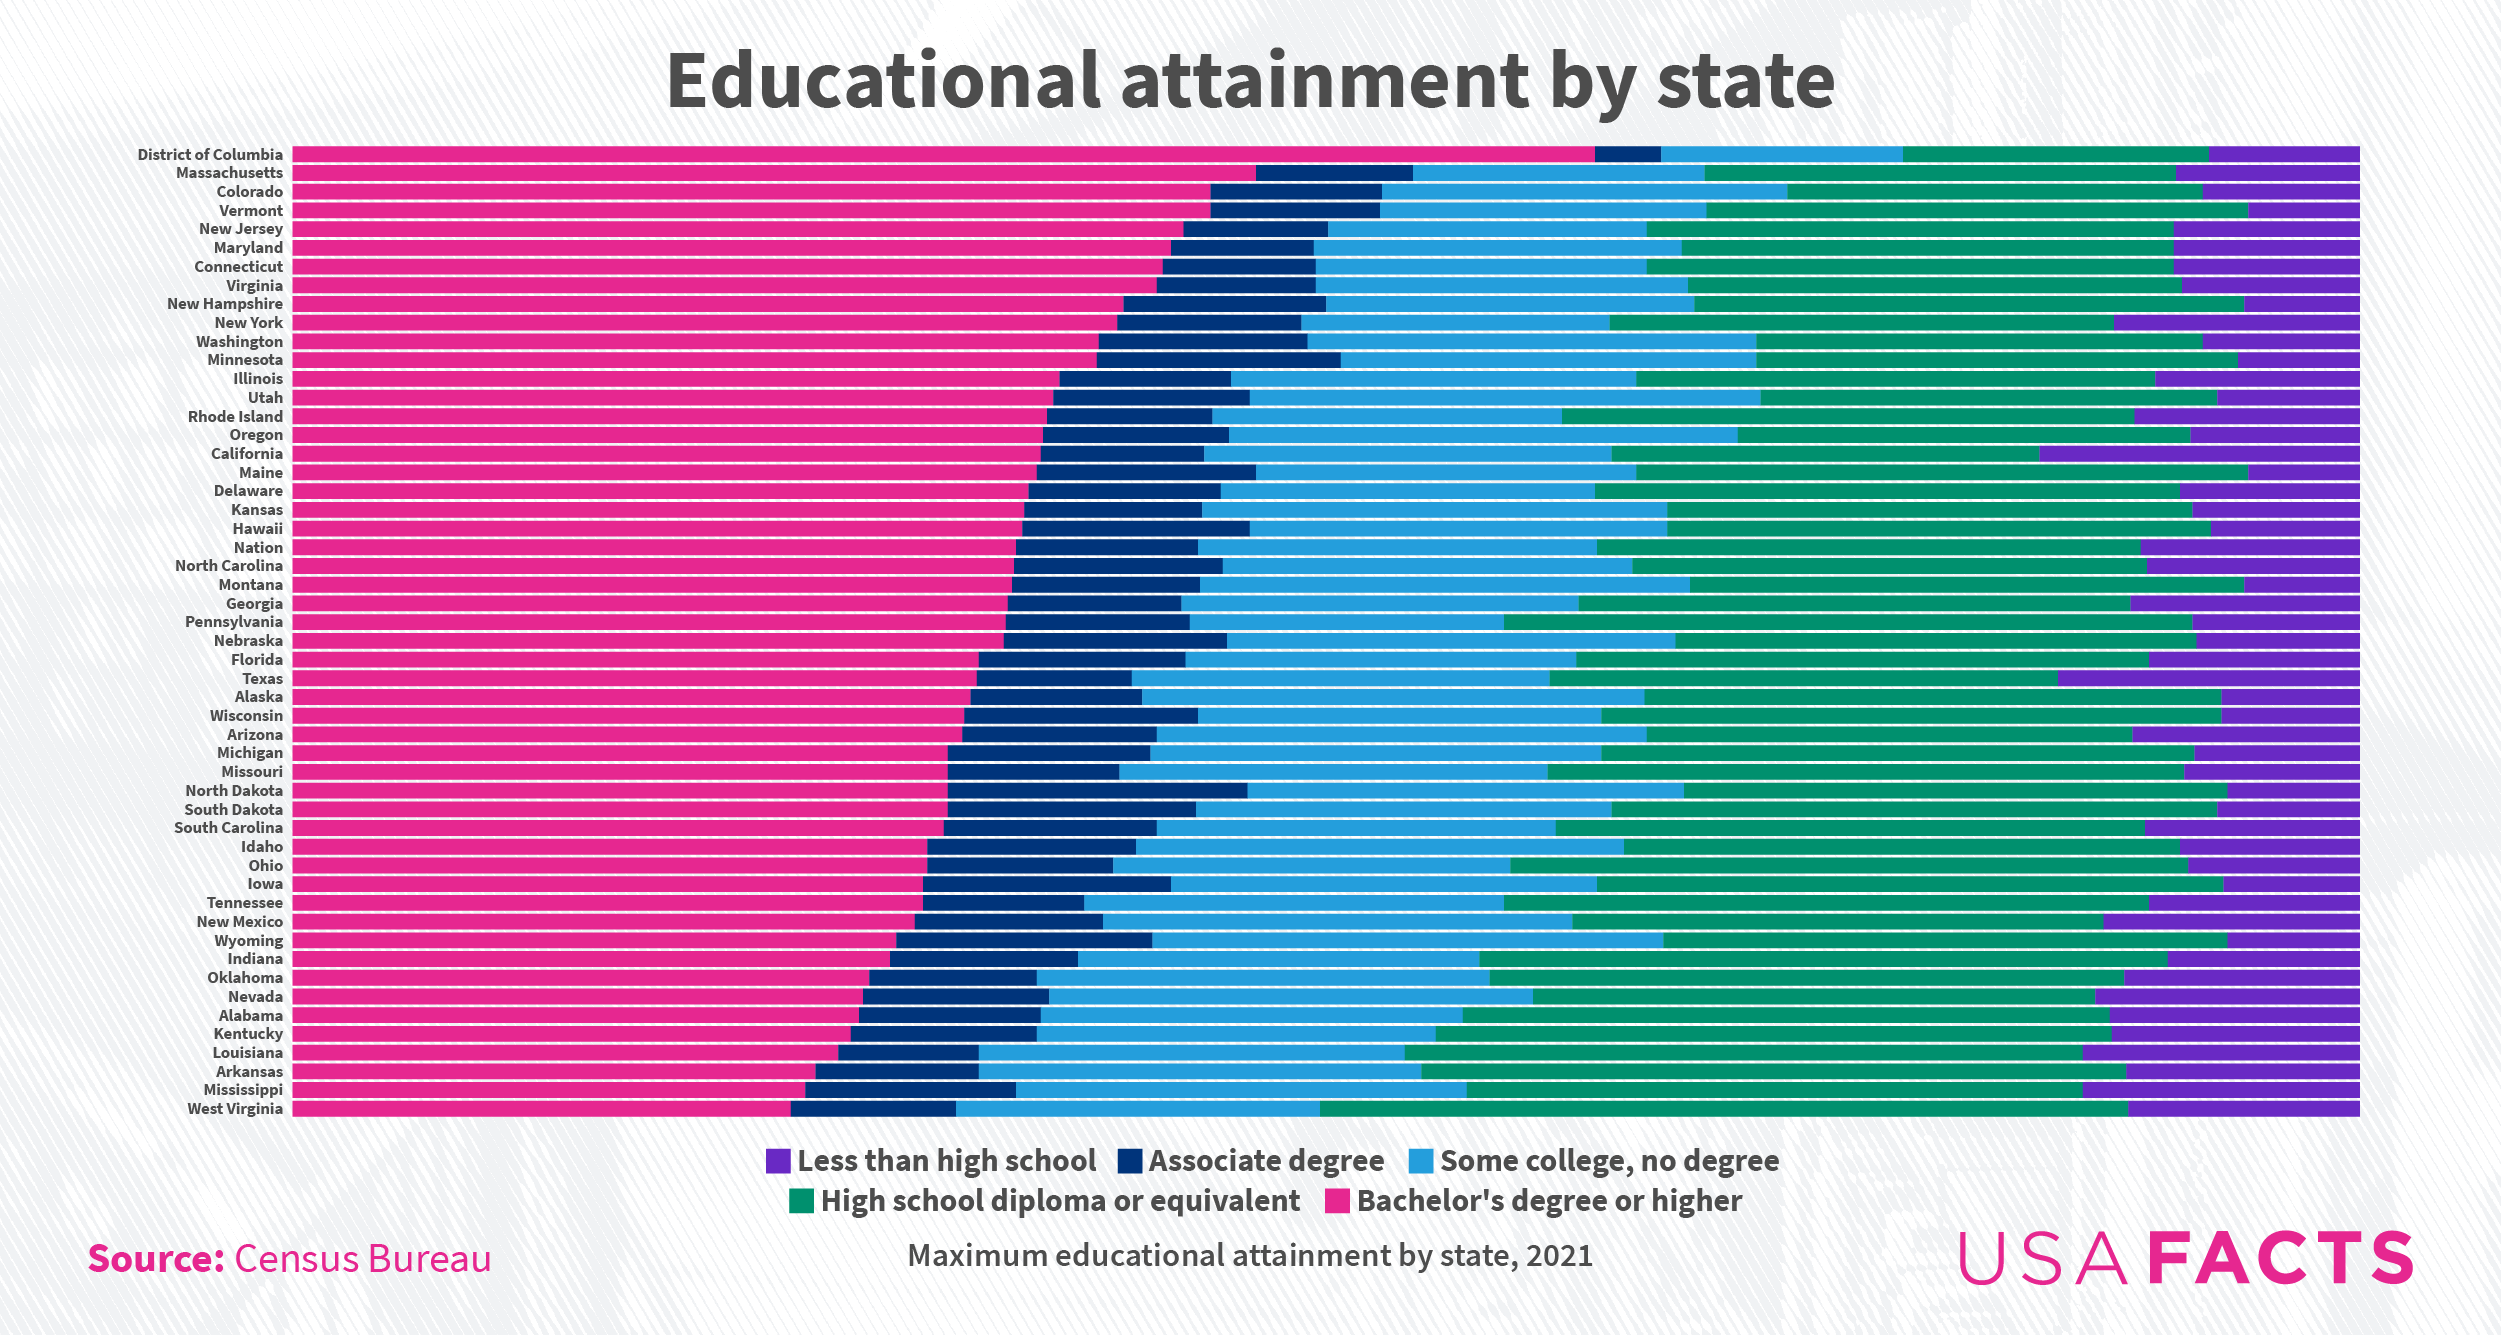
Ideally, post-graduate and post-secondary education would be separate categories. It would help provide more context to education attainment. For example, a big chunk of people in DC have a master's degree.
Holy cow, it’s almost a voting key, too.
I was going to suggest a red/blue overlay
It’s going to tell you exactly what you think it’s going to tell you.
It literally IS a voting key (maybe with NM and UT) switched.
You should put percentage points within each color of each bar. Not very useful but pretty I guess
Very cool. Presume this reflects people currently living in these states not which states produce people who reach the highest level of education? Because, people move around. For example, everyone currently living in DC wasn’t born, raised, or educated there. But by contrast I’m guessing most people don’t stay in WV.
It would be interesting to see a visualization of where people are from and where they were located at Census. It won't show brain drains if at the state level, but could add some nuance. My guess is that it would just make smaller, conservative states look bad though
Mississippi isn't last!!
I would like to see this crossed with Red vs Blue States.
Does this encompass all ages or only adults/18+?
This also needs labels on the right side. And it's interesting how TX, CA, & NY have so many high school dropouts relative to the in-graph neighbouring states.
[removed]
These data would be more beautiful (especially for folks with color vision deficits, like me) if the categories in the legend were in the same order as the bar segments in the chart.
I’d like to see it ordered in reverse
It's interesting to see a large "less than high school" group and a large "Bachelor Degree or higher group (like California and Texas). Wonder what is going on there.
I would arrange the order of the colors by education level, lowest to highest or highest to lowest, and add a category for post-graduate degrees. Also have the order in the key be the same as the graph.
Brooksee83 t1_iynyj3d wrote
Interesting data and nice design, but the order of the legend annoys me 😅