 Swans: The ultimate gift from your true love [OC]
Submitted by TrueBirch t3_zfcoks in dataisbeautiful
TrueBirch OP t1_izb46ol wrote
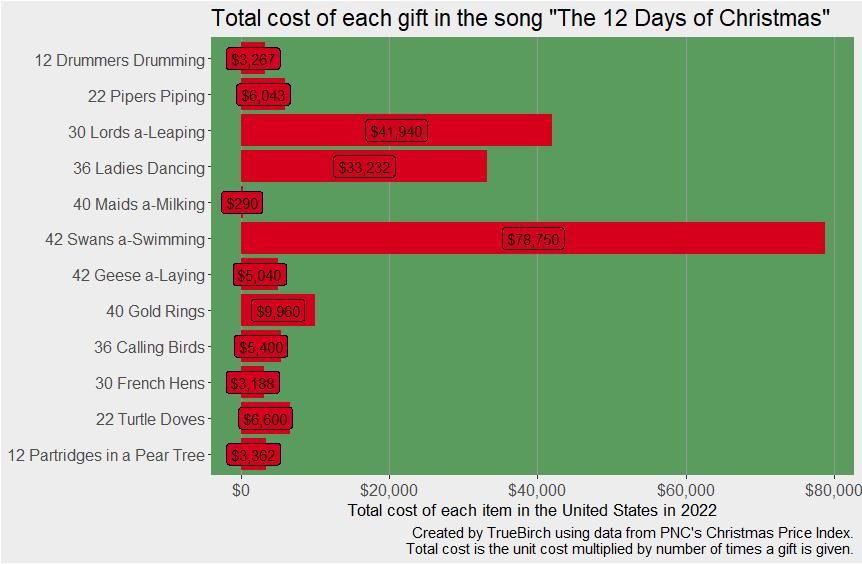
I created the chart using R and ggplot2. The full reproducible code is pasted in a following comment.
This post made me curious about how much you'd have to pay for each set of gift in The 12 Days of Christmas. Turns out PNC Bank tallies the prices every year. They make a few judgement calls, such as treating a "maid a-milking" as the cost of hiring a single individual at the federal minimum wage. Here's how PNC explains its methodology:
>
"The partridge and dove prices came from a national bird supplier. Hatcheries provided the cost of the hens and swans. The price of the geese came from a waterfowl farm. A national pet chain provided the price of the calling birds, or canaries. The pear tree price came from a Pennsylvania nursery. A national jewelry chain provided the cost of five 14-carat gold rings, and PHILADANCO, a modern dance company in Philadelphia, offered the price of ladies dancing, while Philadelphia Ballet supplied the cost of the Lords-a-Leaping. Maids-a-milking are the only unskilled laborers in the PNC CPI and, as such, they reflect the federal minimum wage. Year after year, the sources for the prices remain the same for the most part for consistency, but they have changed on occasion due to changes in the market or business landscape."
TrueBirch OP t1_izb47vx wrote
library(tidyverse)
price <- tibble(item_name = c("12 Partridges in a Pear Tree", "22 Turtle Doves", "30 French Hens",
"36 Calling Birds", "40 Gold Rings", "42 Geese a-Laying", "42 Swans a-Swimming",
"40 Maids a-Milking", "36 Ladies Dancing", "30 Lords a-Leaping",
"22 Pipers Piping", "12 Drummers Drumming"),
total_cost = c(3362.16, 6600, 3187.5, 5399.64, 9960, 5040, 78749.58, 290,
33232.48, 41940, 6042.8, 3266.93)) %>%
mutate(total_cost_rounded = scales::dollar(round(total_cost)))
price$item_name_ordered <-
ordered(price$item_name, levels = price$item_name)
ggplot(price, aes(x = item_name_ordered, y = total_cost, fill = "#D6001C")) +
geom_col() +
geom_label(aes(label = total_cost_rounded),
position = position_stack(
vjust = 0.5)) +
coord_flip() +
labs(
title = "Total cost of each gift in the song \"The 12 Days of Christmas\"",
y = "Total cost of each item in the United States in 2022",
x = NULL,
caption = "Created by TrueBirch using data from PNC's Christmas Price Index.
Total cost is the unit cost multiplied by number of times a gift is given."
) +
scale_y_continuous(label = scales::dollar) +
scale_fill_manual(values = "#D6001C") +
theme(
panel.grid.major = element_line(colour = "gray60"),
panel.grid.minor = element_line(colour = NA),
panel.grid.major.y = element_blank(),
panel.background = element_rect(fill = "#599C5D"),
plot.background = element_rect(fill = "gray93"),
legend.position = "none",
plot.title = element_text(size = 17),
plot.caption = element_text(size = 11),
axis.title = element_text(size = 13),
axis.text = element_text(size = 12),
strip.text = element_text(size = 12)
)
Macrophage87 t1_izbf2f3 wrote
Eew hardcodes
TrueBirch OP t1_izbf9gr wrote
Easiest way to share code without any external dependencies
cwtcap t1_izb6rpv wrote
Getting my credit card out for buying Swans!
Viewing a single comment thread. View all comments