Submitted by TheBroadHorizon t3_10attlh in dataisbeautiful
Submitted by TheBroadHorizon t3_10attlh in dataisbeautiful
Data Source: Uppsala Conflict Data Program
Tools Used: Blender, Python, Illustrator, Photoshop
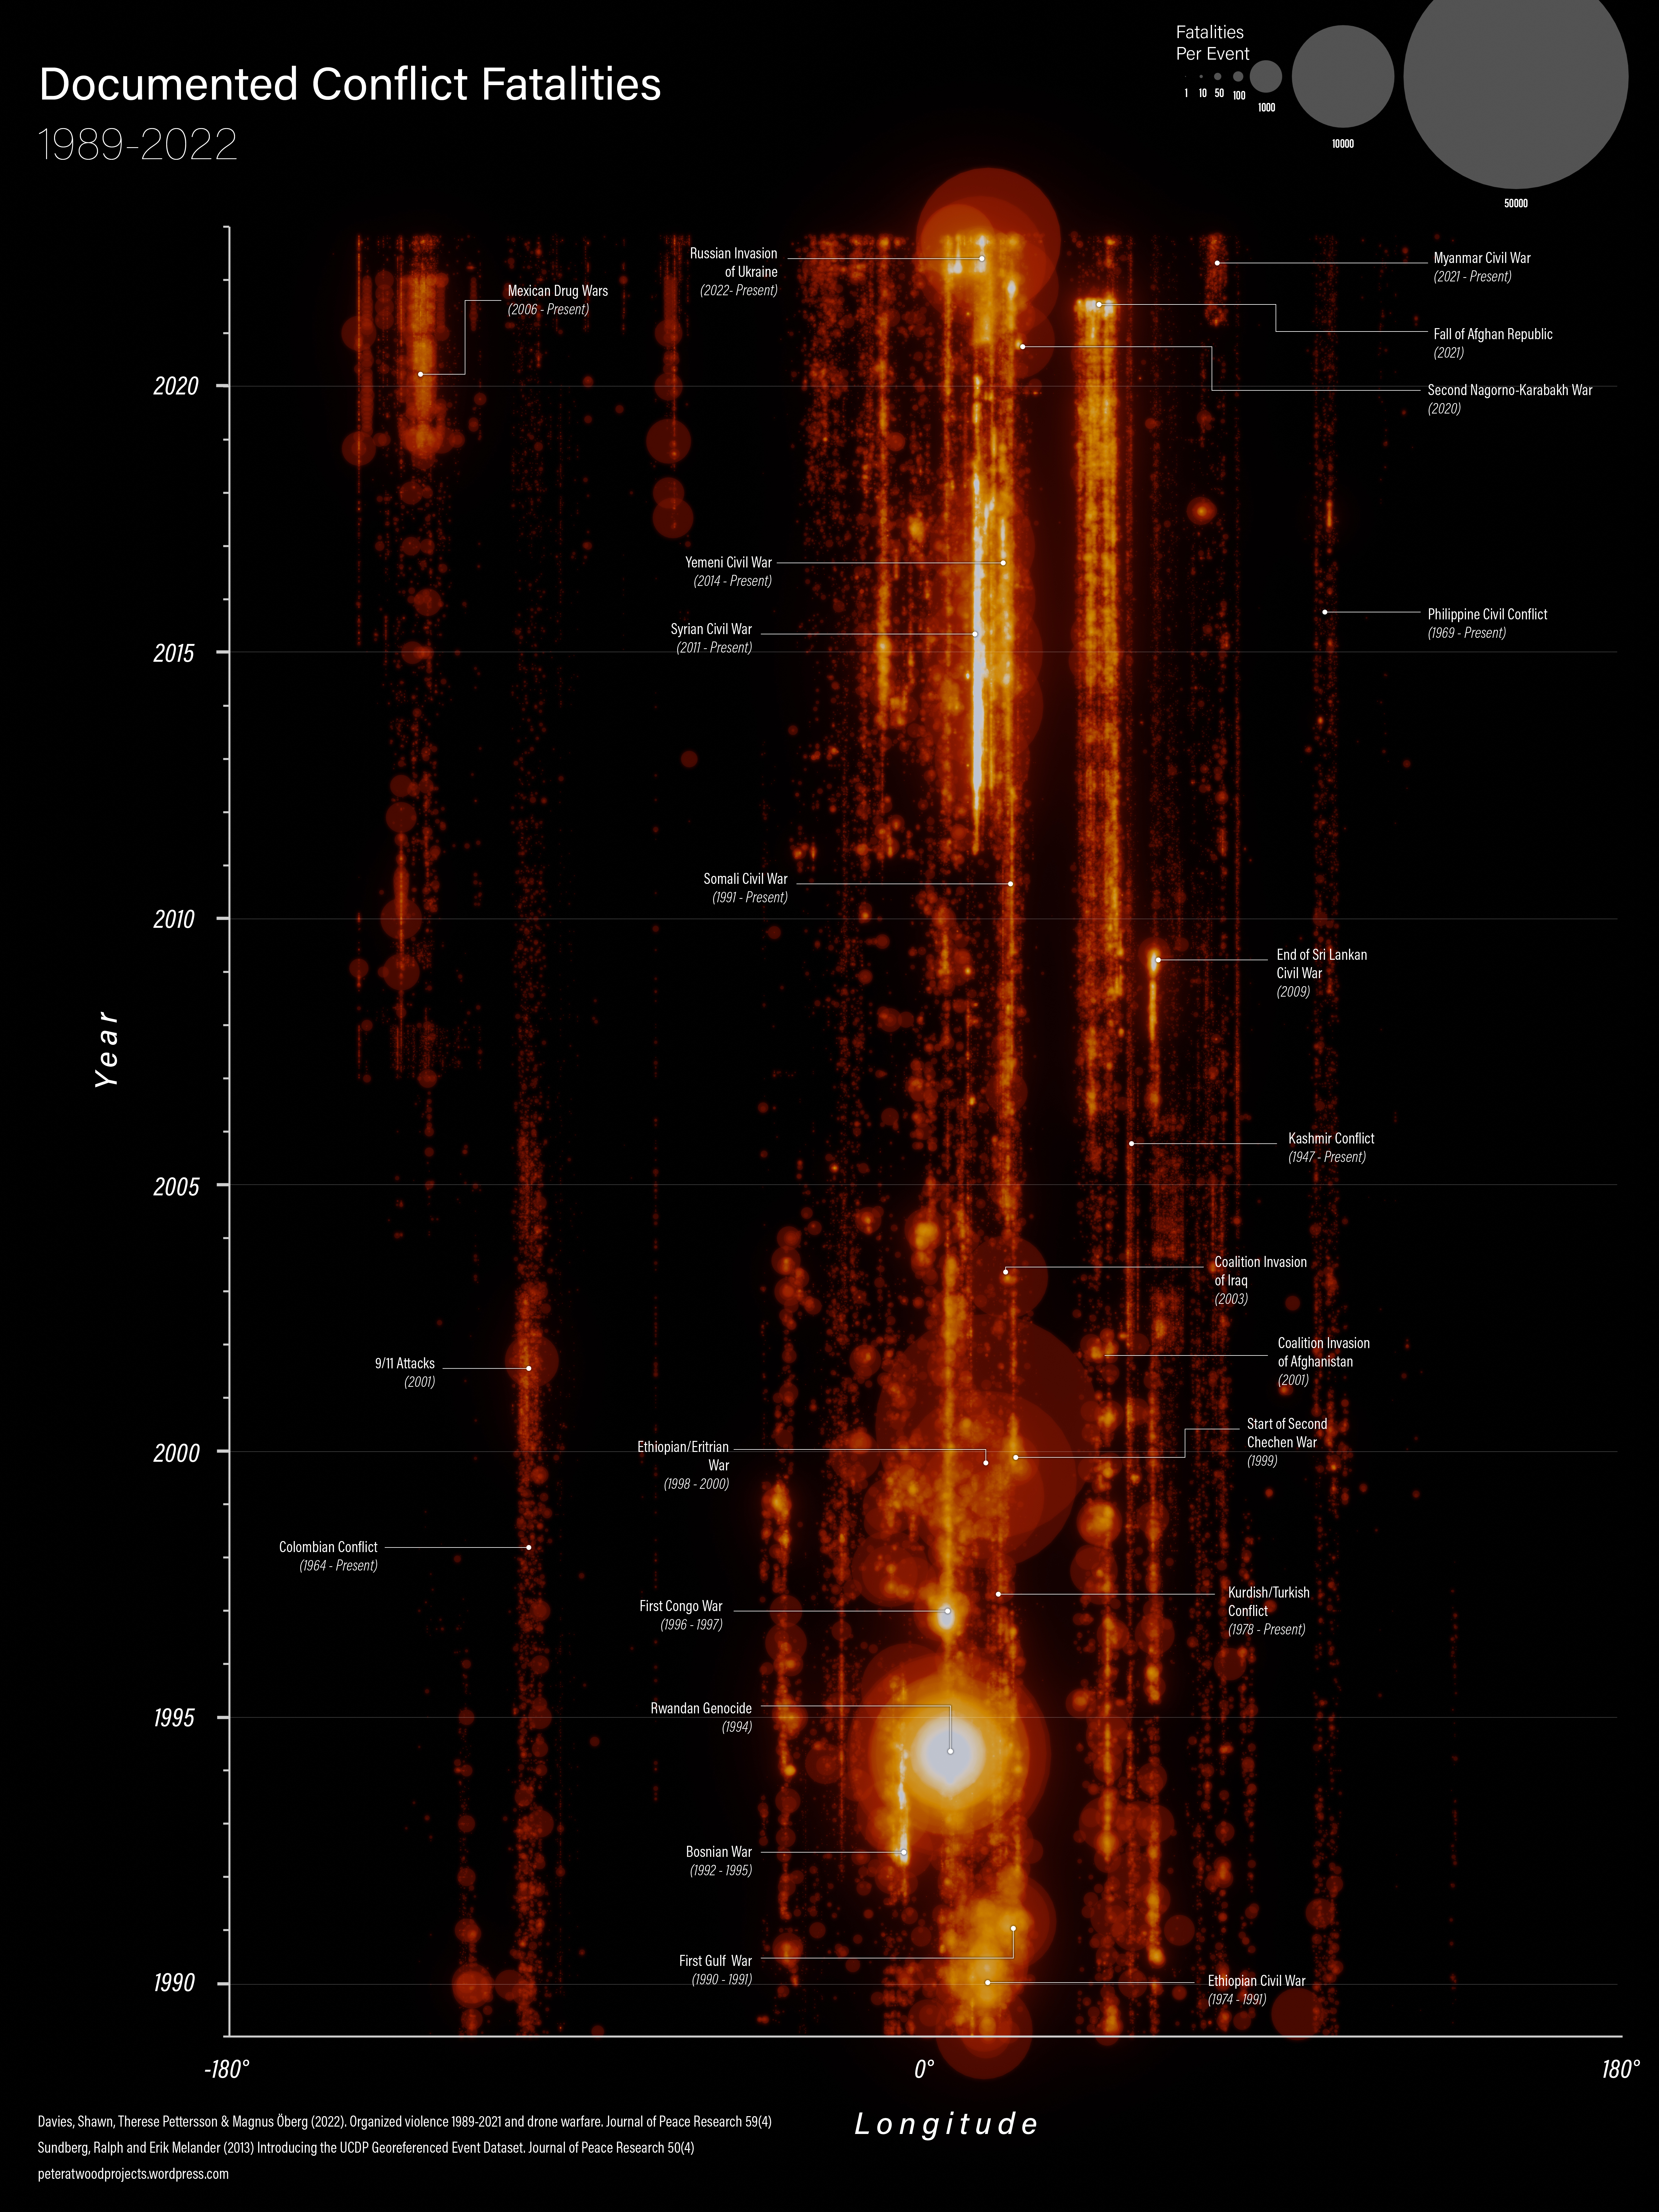
This visualization shows documented conflict fatalities since 1989 as recorded by the Uppsala Conflict Data Program. Each point represents a single event in the dataset with at least one fatality plotted by date and longitude. The size of the points corresponds to the number of fatalities. The brightness corresponds to the density of points (ie. the number of events occurring in roughly the same time/place) A couple of notes about this visualization:
I've also put together a variant that colours the points by continent (link), and one that plots each continent individually (link).
I've also put together a variant that colours the points by continent (link), and one that plots each continent individually (link).
Incredible to look at. Great work on this. Creative and beautiful. Sad data though.
Agree.
I had heard, often about the Rwandan Genocide, but it’s global presence/‘footprint’ here is HUGE.
So much pain & suffering ! But thanks for the enlightening perspective.
Yeah. Rwanda isn’t just a movie “Hotel Rwanda” and I don’t pretend to know a lot about the genocide, but this is sobering data. So many innocent lives. Mom’s, dads, sons, daughters, families, children. In the West, we just overlook this stuff as some blip in the news that doesn’t concern us. “It’s just some poor nation that can’t get their shit together. Whateves” is often the mentality. It’s terrible.
Wow this is a really fantastic visualization. Thanks OP
This is really cool! I stared at it for a long time just looking at how nicely and interestingly it's depicted! Good job!
This looks a lot like an actual non-random-noise spectrogram (save for large circles), wonder how it would sound...
[removed]
[removed]
What is considered here as “fatalities” only civil deaths or military too? Because if second, there are already 100 000 dead ruzkies and that don’t correspond to circles above right. Same with Rwanda.
The dataset includes both civilian and military casualties. Conflicts that are currently active are typically undercounted since fatalities are only added to the database when they can be documented by a third party (i.e. not one of the participants in the conflict). In the case of Russia and Ukraine, most of the casualty reports are coming from the Russian and Ukrainian governments. The database currently lists approximately 65,000 confirmed fatalities up to November 2022 which are shown in the chart.
For the Rwandan genocide, the chart shows approximately 550,000 fatalities which is in line with the general scholarly consensus. Note that the bright spot indicates a large number of overlapping events that occurred at roughly the same time.
This is cool and should be applied to more times and events
Excuse me, the Myanmar civil war has been occurring since 1962 at least
While there has been civil conflict in the country for decades, the current civil war is generally recognized to have begun in the aftermath of the February 2021 military coup.
fun-slinger t1_j466bgd wrote
This is really cool. Have you considered normalizing by available landmass per meridian? Additionally I'd love to see this done along the lines of latitude for a longer period of record. I would suspect that as climatic conditions shift to extremes/higher variability you'd see an interesting pattern with fatalities being higher in the equator lats than poleward ones.
Nic work!