TravisJungroth
TravisJungroth t1_j7htx36 wrote
Reply to comment by supertexter in Analysis showed that 65.6% of women who took extra Vitamin D gave birth naturally. The study analysed results from the MAVIDOS trial which involved 965 women being randomly allocated an extra 1,000 International Units (IU) per day of vitamin D during their pregnancy or a placebo. by Wagamaga
Rounded off.
A: 579/1000
B: 656/1000
p=0.0002
Like the other comment said, remember it's post hoc.
TravisJungroth OP t1_ivc90fn wrote
TravisJungroth OP t1_ivbd6z1 wrote
Reply to comment by [deleted] in [OC] The 2022 MLB Postseason Tree. Arrows go from winner to loser. Teams that lost to the same team are arranged left to right in the order it happened. by TravisJungroth
You might like this more.
TravisJungroth OP t1_ivbav3h wrote
Reply to comment by BroIBeliveAtYou in [OC] The 2022 MLB Postseason Tree. Arrows go from winner to loser. Teams that lost to the same team are arranged left to right in the order it happened. by TravisJungroth
You can view tournament outcomes as partially ordered sets. A team that eliminates another is > that team. This visualization only includes that information. It ignores seeding, except for some influence in the left to right sort.
Normally, we think a team is better because they made it further in the tournament. But what if we only compared teams by which beat which? In that comparison, we know PHI > NYM because PHI > SD > NYM. But, we don’t know that PHI > SEA. There’s no path of elimination between them.
Some things that are a bit easier to see here than a bracket: How many teams each eliminated. It’s just their direct children. Who did the worst, or has the most evidence against them? The bottom line teams don’t look so great. They have lots of evidence against them in terms of losing to teams who lost to other teams. SEA and CLE did as well as each other, except SEA lost to the team that won it all.
It’s certainly a different way of looking at it, and I should have explained it more. I think /r/baseball liked it more because it makes more sense if you have a lot of context. A little bit of context and you probably just think “that’s wrong!”.
It’s not much data, and some would say it isn’t beautiful. But I like simple visualizations that make me see things a different way. If I want upvotes, I should make a Sankey chart of my job search.
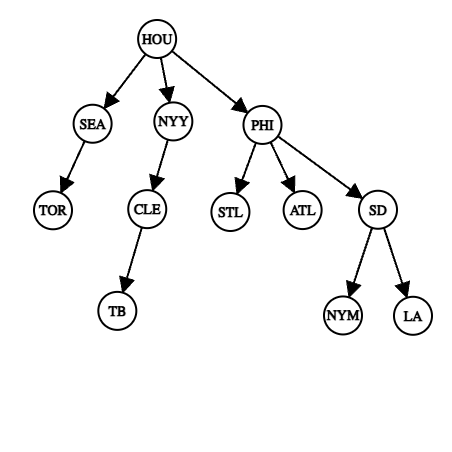 [OC] The 2022 MLB Postseason Tree. Arrows go from winner to loser. Teams that lost to the same team are arranged left to right in the order it happened.
TravisJungroth t1_je7a86h wrote
Reply to comment by brokenthumb11 in TIFU by going on the worst date (& almost ending up in bed with a hooker) by cheeryglitter26
Sex workers are still people and can be visibly uncomfortable. A surprise threesome where the other person is obviously not into would easily be a weird situation. I also think this story was BS but that was one of the most believable parts.
I mean, I’m a software engineer and I’d probably look visibly uncomfortable in a meeting if one of the clients didn’t seem into it.