Submitted by snorkleface t3_10jbr43 in dataisbeautiful
Comments
Any-Bottle-4910 t1_j5jezb0 wrote
Well done!! I started at 232 a year ago. I’m at 207 now with 205 being my lowest. You’re killing it! I know how hard it is.
[deleted] t1_j5jfmls wrote
[removed]
no-stars-in-my-eyes t1_j5jgd3m wrote
Congratulations! I really like the fact that you didn't yo-yo diet like so many others do when they're trying to lose weight. This seems really healthy and you'll definitely keep it off because you worked it in to your daily routine!
snorkleface OP t1_j5jgf3z wrote
Thank you! Congrats to you too!
My next goal is just 5 pounds lighter at 205. If I can then maintain somewhere between 205-210 I'll be a happy guy. Haven't been that light in 10 years
snorkleface OP t1_j5jgykc wrote
Thank you! Depends how you interpret the chart haha, there's a lot of up and down swings.
I track every day to increase data accuracy and to keep myself accountable. But even if my day to days varied a lot, I tried to stick to the magic 0.5-1lb loss per week on average.
Any-Bottle-4910 t1_j5jitda wrote
Very similar here. My goal is 199, though that may trend lower if it doesn’t look as I imagine. Either way, glad to see someone else seeing results.
It’s hard!
greatdrams23 t1_j5jj9er wrote
Congrats to all of you. I found graphing it really motivating, it makes me want to get that line down.
AlexMTBDude t1_j5jkgxf wrote
Kilos? Wow! That's... a lot!
snorkleface OP t1_j5jks2m wrote
Lmao good point on my needing proper labels. When I built this originally I didn't intend for anyone to see it but me.
stickybuttflaps t1_j5js5k9 wrote
The y-axis isn't labeled and the x-axis has no scale at all.
snorkleface OP t1_j5jsvqq wrote
You're right, I built this for myself originally not intending for anyone else to see it.
The x-axis is labeled its just hard to see. It's called a "continuous axis" vs a "categorical" one. Categorical shows each data point (in this case a single day). Continuous auto-adjusts to show only the big-picture metric over time.
In other words, what my weight was on December 27th isn't important. What is important is my trend over time. Hope that makes sense.
[deleted] t1_j5jx3ii wrote
[removed]
Vmagnum t1_j5k5hy4 wrote
Are you me? I did the exact same thing several years ago starting at about the same weight and also using a 3-day rolling average. Lol. Good job 👍
snorkleface OP t1_j5k8p2i wrote
Haha that's awesome! Good work to you too!
Vmagnum t1_j5kanzf wrote
Oh that was a while back, I’ve found it all again 😜. Need to fire up the ‘ol Excel sheet and start over again
InsuranceToTheRescue t1_j5kyfyy wrote
What does physical activity look like in your life?
snorkleface OP t1_j5kz46b wrote
Decently high. Exercise 5x/week (3x weights, 2x cardio). I'm on my feet walking a solid 5 hours per day. Then whatever I'm doing around the house, I do a lot of DIY.
CypherMcAfee t1_j5lnm5x wrote
is this an app? or you inserted your data?
congrats on the journey and keep going strong!
[deleted] t1_j5nwi41 wrote
[removed]

snorkleface OP t1_j5jenzl wrote
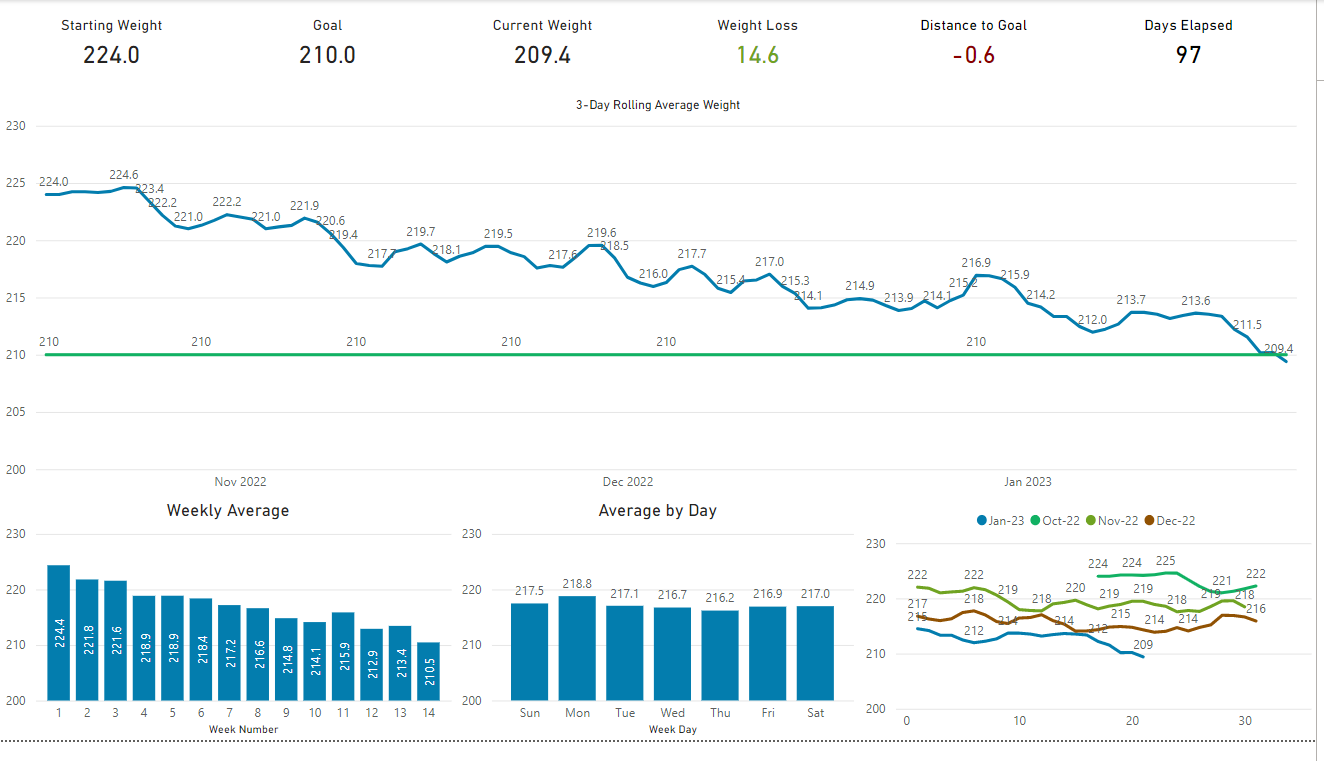
Source: I weighed myself every day, logged into Excel
Tool: Excel into Power BI for visualizations
I used a 3-day rolling average as my primary metric to smooth out the high variability day to day. While I hit my goal a few times on a single day, I only considered my goal met when the 3 day rolling number hit the line.
Starting a weight loss journey around the holidays is tough, but not impossible. You can see some of the big upswings when viewing at the week level are all around the big holidays and weekends where we had holiday "stuff" going on (eating and drinking a lot). Week 11 started the Monday after Christmas, the only WoW increase in weight up until that point.
Another interesting, but maybe not surprising, datapoint is my average by day. Mondays are always my heaviest (coming off of the weekend) and Thursdays are always my lightest (coming off Mon-Wed of healthy eating and exercise). By this logic Fridays should be my lightest, but about half the time I give up by Thursday night and have some wings and beer.